Difference between revisions of "STAMP image gallery"
| Line 12: | Line 12: | ||
Image:STAMP2_EBPR_ScatterPlot.png|SEED subsystem scatter plot for a pair of enhanced biological phosphorus removal (EBPR) sludge metagenomes (data described in [http://www.ncbi.nlm.nih.gov/pubmed/16998472 Martín et al., 2006]). | Image:STAMP2_EBPR_ScatterPlot.png|SEED subsystem scatter plot for a pair of enhanced biological phosphorus removal (EBPR) sludge metagenomes (data described in [http://www.ncbi.nlm.nih.gov/pubmed/16998472 Martín et al., 2006]). | ||
| − | Image: | + | Image:STAMP2_IronMinSequenceHistogram.png|Sequence histogram for a functional profile of two iron mine metagenomes (data described in [http://www.ncbi.nlm.nih.gov/pubmed/16549033 Edwards et al., 2006]). |
Image:MultipleComparisonPlots StoreyFDR.png|Multiple comparison plots for assessing the results of Storey's false discovery rate method (see [http://www.ncbi.nlm.nih.gov/pubmed/19033188 Leek and Storey, 2008]). | Image:MultipleComparisonPlots StoreyFDR.png|Multiple comparison plots for assessing the results of Storey's false discovery rate method (see [http://www.ncbi.nlm.nih.gov/pubmed/19033188 Leek and Storey, 2008]). | ||
Image:IronMine pValueHistogram.png|p-value histogram for two iron mine metagenomes (data described in [http://www.ncbi.nlm.nih.gov/pubmed/16549033 Edwards et al., 2006]). | Image:IronMine pValueHistogram.png|p-value histogram for two iron mine metagenomes (data described in [http://www.ncbi.nlm.nih.gov/pubmed/16549033 Edwards et al., 2006]). | ||
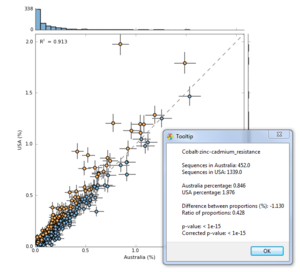
Image:EBPR_Aphosphatis_ScatterplotHistogram.png|Scatterplot with histograms showing the functional profile of A.phosphatis sequences from two EBPR communities(data described in [http://www.ncbi.nlm.nih.gov/pubmed/20130030 Parks and Beiko, 2010]). | Image:EBPR_Aphosphatis_ScatterplotHistogram.png|Scatterplot with histograms showing the functional profile of A.phosphatis sequences from two EBPR communities(data described in [http://www.ncbi.nlm.nih.gov/pubmed/20130030 Parks and Beiko, 2010]). | ||
</gallery> | </gallery> | ||
Revision as of 14:07, 11 August 2011
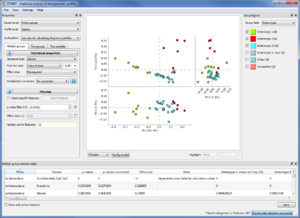
Screen capture of STAMP v2.0.0 on Microsoft Windows 7 (x64).
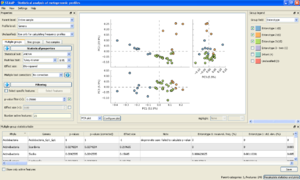
Screen capture of STAMP v2.0.0 on Microsoft Windows XP.
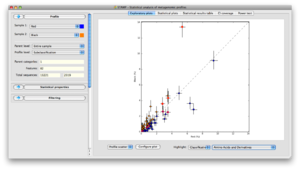
Screen capture of STAMP v1.0 on Apple's Mac OS X Leopard.
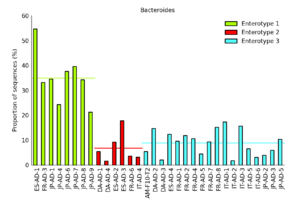
Bar plot showing the abundance of Bacteriodes within the gut microbiota of individuals assigned to the 3 enterotypes proposed by Arumugam and colleagues (data described in Arumugam et al., 2011).
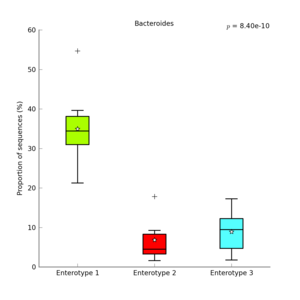
Box plot showing the abundance of Bacteriodes within the gut microbiota of individuals assigned to the 3 enterotypes proposed by Arumugam and colleagues (data described in Arumugam et al., 2011).
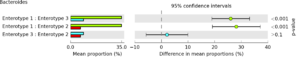
Post-hoc plot indicating that Bacteriodes is significantly over-represented in enterotype 1 compared to the 2 other enterotypes proposed by Arumugam and colleagues (data described in Arumugam et al., 2011).
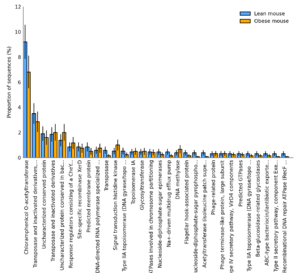
Functional profile plot for an obese and a lean mouse microbiome (data described in Turnbaugh et al., 2006).
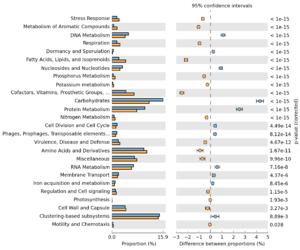
Extended error bar plot for a pair of bovine rumen microbiomes (data described in Brulc et al., 2009).
SEED subsystem scatter plot for a pair of enhanced biological phosphorus removal (EBPR) sludge metagenomes (data described in Martín et al., 2006).
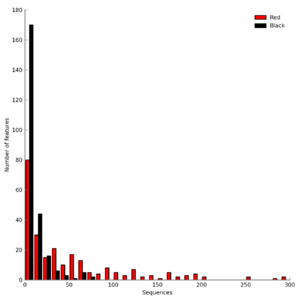
Sequence histogram for a functional profile of two iron mine metagenomes (data described in Edwards et al., 2006).
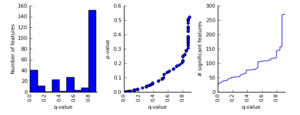
Multiple comparison plots for assessing the results of Storey's false discovery rate method (see Leek and Storey, 2008).
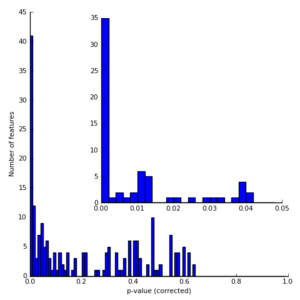
p-value histogram for two iron mine metagenomes (data described in Edwards et al., 2006).
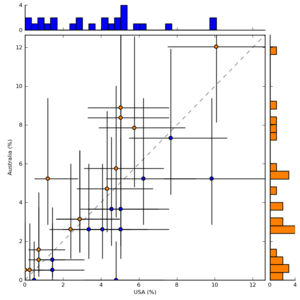
Scatterplot with histograms showing the functional profile of A.phosphatis sequences from two EBPR communities(data described in Parks and Beiko, 2010).


