Difference between revisions of "Description of GenGIS plugins"
| Line 8: | Line 8: | ||
=Alpha Diversity Visualizer= | =Alpha Diversity Visualizer= | ||
| + | |||
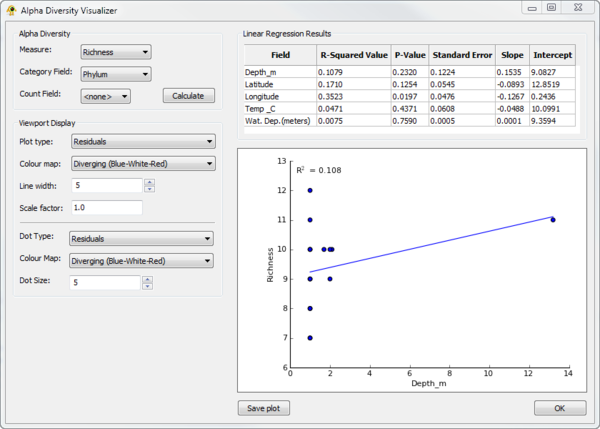
| + | The ''Alpha Diversity Visualizer'' plugin can calculate [http://en.wikipedia.org/wiki/Alpha_diversity alpha diversity] for active locations, regress alpha diversity against location specific metadata, and produce visualizations of the resulting linear regression analysis. It currently calculate richness, Shannon, and Simpson alpha diversity. To calculate alpha diversity, you must select the ''Measure'' you wish to calculate and the ''Category field'' in your sequence file over which diversity will be calculate (Fig. 2). You may optionally select a ''Count field'' which indicates the number of times a given sequence is observed at a location. Pressing ''Calculate'' causes alpha diversity to be calculated. Linear regression results of alpha diversity versus all numeric fields associated with locations are reported within the ''Linear Regression Results'' table. Selecting a row within this table causes a linear regression scatter plot of alpha diversity versus the selected ''Field'' to be generated. The ''Viewport Display'' section allows different Viewport visualization to be produced. | ||
[[Image:AlphaDiversityVisualizer.png|thumb|center|600px|Figure 2. Alpha Diversity Visualizer plugin.]] | [[Image:AlphaDiversityVisualizer.png|thumb|center|600px|Figure 2. Alpha Diversity Visualizer plugin.]] | ||
Revision as of 10:12, 4 March 2012
GenGIS provides the following Python plugins which can be accessed through the Plugins menu.
Contents
Alpha Diversity
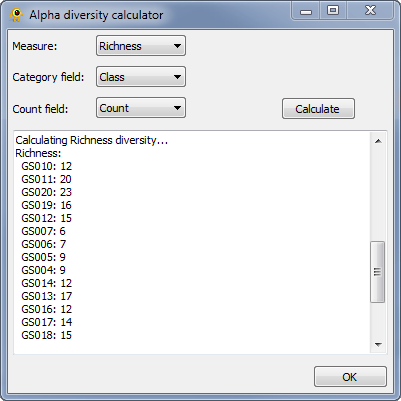
The Alpha Diversity plugin calculates alpha diversity for active locations. It currently calculate richness, Shannon, and Simpson alpha diversity. To calculate alpha diversity, you must select the Measure you wish to calculate and the Category field in your sequence file over which diversity will be calculate (Fig. 1). You may optionally select a Count field which indicates the number of times a given sequence is observed at a location. Pressing Calculate causes alpha diversity to be calculated. Results are reported within the plugin and added to the location table for use within GenGIS and other plugins.
Alpha Diversity Visualizer
The Alpha Diversity Visualizer plugin can calculate alpha diversity for active locations, regress alpha diversity against location specific metadata, and produce visualizations of the resulting linear regression analysis. It currently calculate richness, Shannon, and Simpson alpha diversity. To calculate alpha diversity, you must select the Measure you wish to calculate and the Category field in your sequence file over which diversity will be calculate (Fig. 2). You may optionally select a Count field which indicates the number of times a given sequence is observed at a location. Pressing Calculate causes alpha diversity to be calculated. Linear regression results of alpha diversity versus all numeric fields associated with locations are reported within the Linear Regression Results table. Selecting a row within this table causes a linear regression scatter plot of alpha diversity versus the selected Field to be generated. The Viewport Display section allows different Viewport visualization to be produced.
Dissimilarity Matrix Viewer
Linear Regression
Location Table Viewer
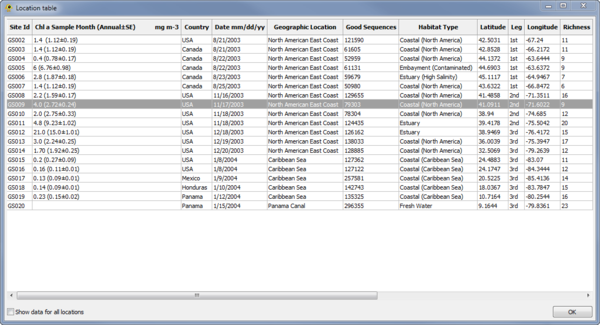
The Location Table Viewer plugin display a table indicating the metadata associated with each location (Fig. 7). Other plugins and custom Python scripts can be used to add data to the Location Table. By default, only data for active locations is shown. To show data for all locations check the Show data for all locations checkbox.
Mantel
Sequence Table Viewer
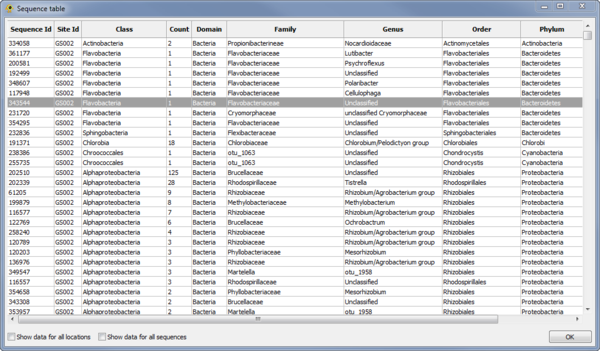
The Sequence Table Viewer plugin display a table indicating the metadata associated with each sequence (Fig. 9). Other plugins and custom Python scripts can be used to add data to the Sequence Table. By default, only data for active locations and active sequences is shown. To show data for all locations check the Show data for all locations checkbox. To show data for all sequences check the Show data for all sequences checkbox.
