Difference between revisions of "GenGIS Tutorials"
| Line 4: | Line 4: | ||
Instructions on how to contruct a custom DEM using the data available from the [http://edc.usgs.gov/products/elevation/gtopo30/gtopo30.html GTOPO30 site] is available [[GTOP030 Tutorial|here]]. | Instructions on how to contruct a custom DEM using the data available from the [http://edc.usgs.gov/products/elevation/gtopo30/gtopo30.html GTOPO30 site] is available [[GTOP030 Tutorial|here]]. | ||
| + | |||
=== Tutorial 1: ''Banza'' Katydids of the Hawaiian Islands === | === Tutorial 1: ''Banza'' Katydids of the Hawaiian Islands === | ||
| Line 16: | Line 17: | ||
* [[Media:GenGIS_Katydids_Data.zip|Download katydid data set]] | * [[Media:GenGIS_Katydids_Data.zip|Download katydid data set]] | ||
| + | |||
=== Tutorial 2: Marine Microbial Communities from the Atlantic Seaboard === | === Tutorial 2: Marine Microbial Communities from the Atlantic Seaboard === | ||
| Line 24: | Line 26: | ||
* [[Media:GenGIS_GOS_Data.zip|Download GOS data set]] | * [[Media:GenGIS_GOS_Data.zip|Download GOS data set]] | ||
| + | |||
=== Tutorial 3: Building a Custom Data Visualizaiton === | === Tutorial 3: Building a Custom Data Visualizaiton === | ||
Revision as of 13:11, 28 May 2009
We have put together a few tutorials to get you quickly started with GenGIS.
Contents
Tutorial 0: Construct a Custom Digital Elevation Maps (DEM)
Instructions on how to contruct a custom DEM using the data available from the GTOPO30 site is available here.
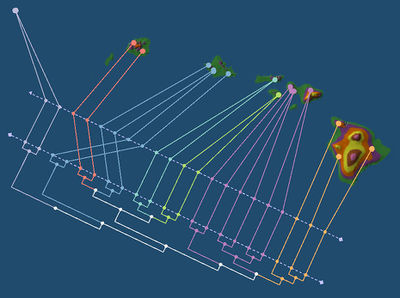
Tutorial 1: Banza Katydids of the Hawaiian Islands
In this tutorial, we consider the phylogenetic tree of Banza katydids (acoustic insects) from the Hawaiian Islands recently recovered by Shapiro et al. [1]. GenGIS will be used to investigate whether or not this phylogeny is related to the geography of the Hawaiian Islands.
Tutorial 2: Marine Microbial Communities from the Atlantic Seaboard
In this tutorial, we examine samples collected as part of the Global Ocean Sampling metagenomic survey [2] in order to investigate the influence of environmental factors on the composition of microbial communities from marine ecosystems.
Tutorial 3: Building a Custom Data Visualizaiton
An example showing how GenGIS can be used to visualize the mobility rates of HIV-1 subtype B in Europe as proposed by Paraskevis et al. (2009) has been posted here. This example includes a Python class demonstrating how a custom visualization can be made.
References
[1] L. H. Shapiro, J. S. Strazanac, and G. K. Roderick. (2006) Molecular phylogeny of Banza (Orthoptera: Tettigoniidae), the endemic katydids of the Hawaiian Archipelago. Mol. Phylogenet. Evol. 41:53-63. Pubmed
[2] D. Rusch, A. Halpern, G. Sutton, et al., (2007) "The Sorcerer II Global Ocean Sampling Expedition: Northwest Atlantic through Eastern Tropical Pacific," PLoS Biol. 5:e77. PubMed
