Difference between revisions of "HIV-1 subtype B mobility in Europe"
| Line 34: | Line 34: | ||
* Which pairs of countries have an import or export rate above or below a given level? | * Which pairs of countries have an import or export rate above or below a given level? | ||
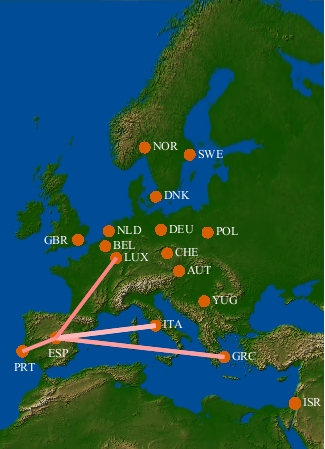
| − | [[Image:HIV_spain_export.jpg|frame|left|Relative rate of 'export' of HIV-1 subtype B from Spain (ESP) to Greece (GRC), Italy (ITA), Portugal (PRT), and | + | [[Image:HIV_spain_export.jpg|frame|left|Relative rate of 'export' of HIV-1 subtype B from Spain (ESP) to Greece (GRC), Italy (ITA), Portugal (PRT), and Luxembourg (LUX).]] |
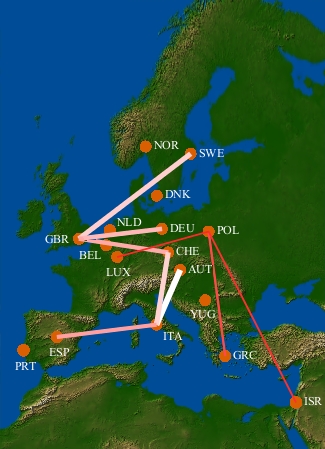
| − | [[Image:HIV_Export_GBR_POL_ITA.jpg|frame|right|Top three countries | + | [[Image:HIV_Export_GBR_POL_ITA.jpg|frame|right|Top three H1V-1 subtype B exporting countries: Britain (GBR), Poland (POL), and Italy (ITA).]] |
Revision as of 00:24, 16 June 2010
Paraskevis et al. (2009) recently used a phylogeographic analyses to determine rates of import and export of HIV-1 subtype B for seventeen European countries. To gain insight into how HIV-1 subtype B is spreading within Europe requires investigating the rates of import and export between these countries. Here we demonstrate how a custom data visualization can be quickly implemented within GenGIS in order to interactive explore this dataset. If you wish to explore this dataset yourself you can download the relevent data files here.
To explore this data we first need to load a map of Europe along with a location set file indicating the geographic position of the seventeen countries considered by Paraskevis et al. You can load in this data files through the GenGIS graphical interface or using the Python console:
import os
os.chdir('X:\\my_data\\EuropeHIV')
openMap('europe.ascii')
openLocations('locations.csv')
GenGIS ships with a script to make accessing data within the Python console simpler. We can access the location data using:
import dataHelper as dh
locData = dh.getLocationSetData()
We can now import our class for visualizing information in a distance matrix:
import DistMatrix as dm
hivDistMatrix = dm.DistMatrix('migrations.dst', locData)
Lines indicating the relative rates of mobility of HIV-1 subtype B between two countries can be drawn using the DrawLines method. For example, the relative rate of 'export' from Spain (ESP) to Greece (GRC), Italy (ITA), Portugal (PRT), and Luxemburg (LUX) is given by:
hivDistMatrix.DrawLines([['ESP','GRC'],['ESP', 'ITA'],['ESP', 'PRT'],['ESP','LUX']])
This will result in the visualization on the left. The relative rates of 'export' of HIV-1 subtype B is indicated by increasing the thickness and lightness of the line with increasing rates of export. This function allows a priori hypotheses about the relative reates of 'export' and 'import' to be quickly investigated. To investigate a new hypothesis, the current display can be cleared using the clearLines() function. We can also investigate the data in a more exploratory manner. The DistMatrix class provides a function for showing the most significant 'exporters' or 'importers' for a country. For example, we can determine the top three countries Britian (GBR), Poland (POL), and Italy (ITA) export to as follows:
clearLines()
hivDistMatrix.DrawTopDist('GBR', 3, 'exporter')
hivDistMatrix.DrawTopDist('POL', 3, 'exporter')
hivDistMatrix.DrawTopDist('ITA', 3, 'exporter')
The results are shown in the visualization on the right. It shows that Poland is not a primary exporter as discussed by Paraskevis et al. (2009). New functionality can easily be added to the DistMatrix class to allow other aspects of the data to be quickly investigated such as:
- What are the top exporting countries? What countries do they primarily export to?
- Which pairs of countries have an import or export rate above or below a given level?

