File list
From The GenGIS wiki
Jump to navigationJump to searchThis special page shows all uploaded files.
| Date | Name | Thumbnail | Size | User | Description | Versions |
|---|---|---|---|---|---|---|
| 01:13, 26 August 2009 | Aa sequences.zip (file) | 6 KB | Dparks | Sequence file used in Tracking the evolution and geographic spread of Influenza A analysis. | 1 | |
| 13:21, 22 July 2013 | Add remove.png (file) |  |
64 KB | Alex | Reverted to version as of 13:21, 22 July 2013 | 5 |
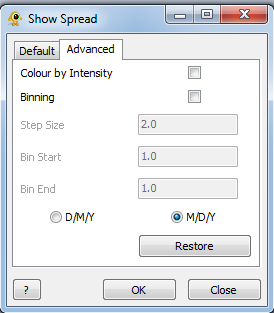
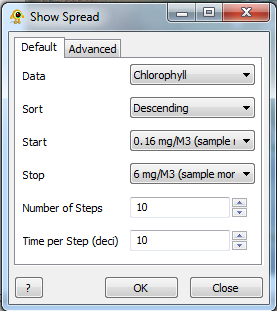
| 16:48, 18 June 2014 | AdvancedView.png (file) |  |
16 KB | Alex | advanced view for show spread | 1 |
| 19:34, 23 May 2009 | Africa.tif (file) | 1.32 MB | Dparks | Africa GeoTIFF file. | 1 | |
| 13:55, 17 July 2009 | Africa hiv.zip (file) | 399 KB | Dparks | Non-recombinant HIV-1 subtypes in Africa (Parks et al., Genome Res., 2009). | 1 | |
| 13:54, 17 July 2009 | Aftica hiv.zip (file) | 399 KB | Dparks | Non-recombinant HIV-1 subtypes in Africa (Parks et al., Genome Res., 2009). | 1 | |
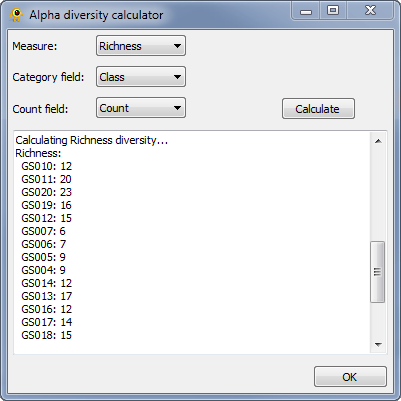
| 16:20, 26 March 2012 | AlphaDiv.png (file) |  |
30 KB | Dparks | 2 | |
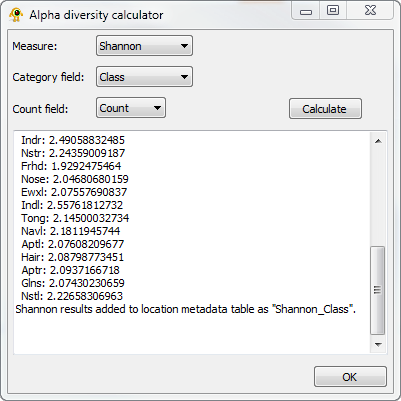
| 15:08, 4 March 2012 | AlphaDiversityCalculator.png (file) |  |
30 KB | Dparks | 1 | |
| 16:50, 5 March 2012 | AlphaDiversityVisualizer.png (file) |  |
59 KB | Dparks | 3 | |
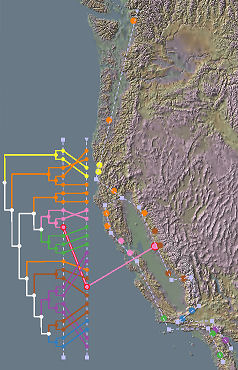
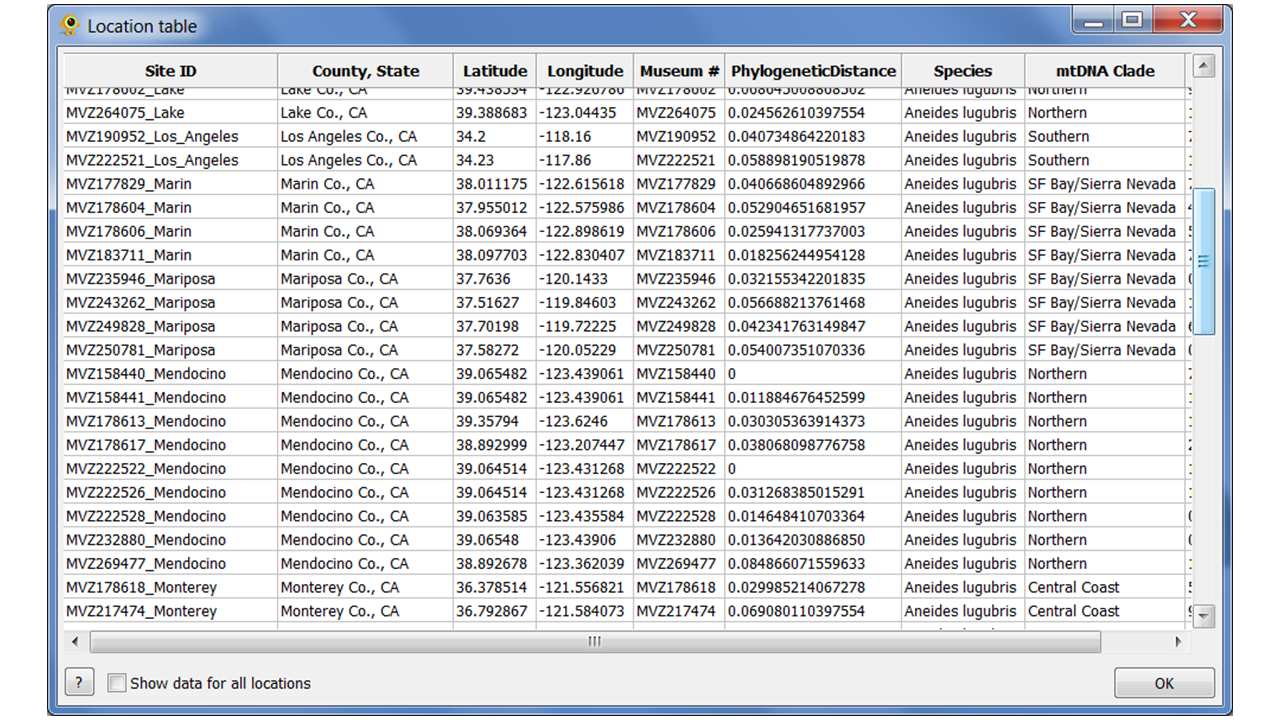
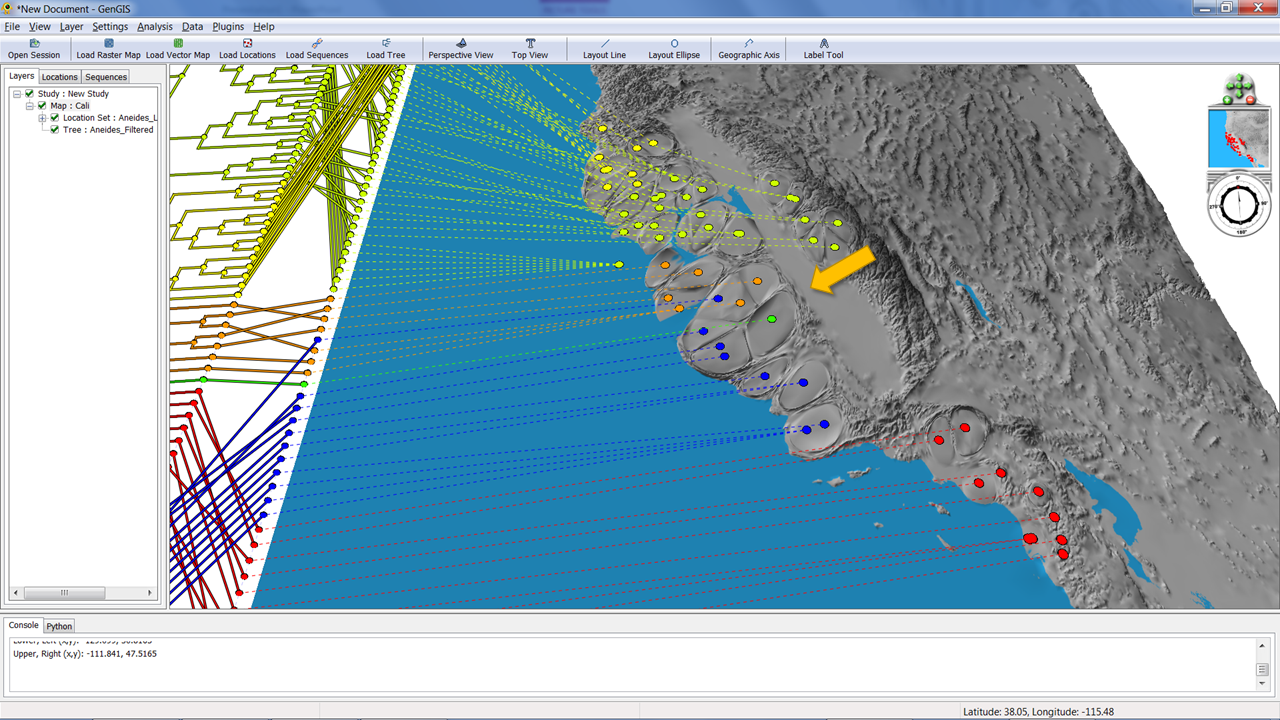
| 14:12, 16 May 2017 | Aneides.zip (file) | 4.34 MB | Beiko | Archive containing the following files: - Cali.tif: the basemap - Aneides_locations_filtered.csv: the location file - Aneides_Filtered.tre: the mtDNA tree, with leaf labels corresponding to location IDs | 2 | |
| 13:43, 16 May 2017 | Aneides Untransformed.png (file) | 700 KB | Alex | 2 | ||
| 13:44, 16 May 2017 | Aneides l15 m5.png (file) |  |
816 KB | Alex | 2 | |
| 16:21, 14 May 2009 | Apr27-XPress.swf (file) | 5.02 MB | Beiko | 1 | ||
| 17:47, 8 June 2011 | Atlantic seaboard.zip (file) | 935 KB | Timothy | digital elevation map of Atlantic seaboard | 1 | |
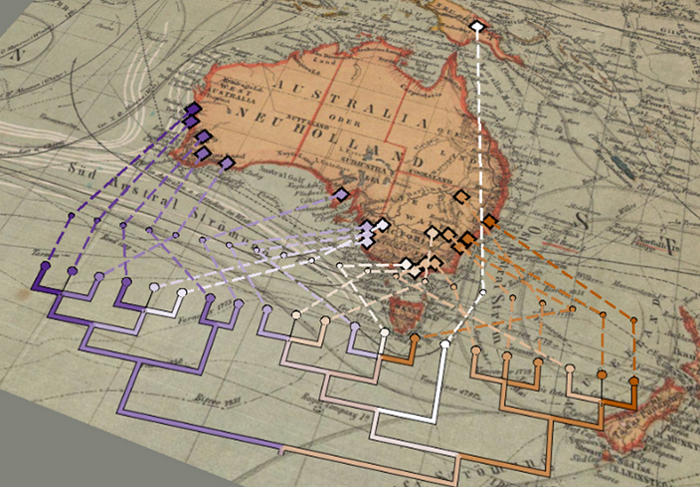
| 18:49, 7 August 2014 | AusOldWorld.png (file) |  |
879 KB | Beiko | Kangaroo apple phylogeny (Poczai et al., 2011: http://www.ncbi.nlm.nih.gov/pubmed/21258867) mapped onto old map of Australia | 1 |
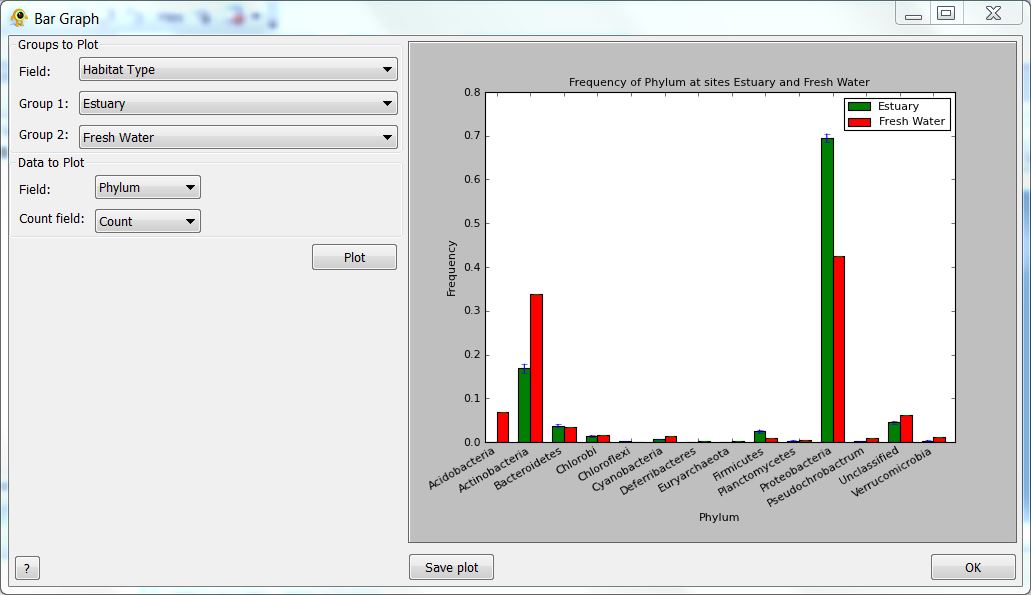
| 01:52, 5 April 2013 | BarPlotPlugin.jpg (file) |  |
72 KB | Dparks | 1 | |
| 12:50, 8 August 2013 | Basemap larger x264.mp4 (file) | 27.11 MB | Beiko | 1 | ||
| 13:24, 22 July 2013 | Basic.png (file) |  |
53 KB | Alex | 2 | |
| 18:38, 2 May 2009 | Beiko et al FOSS4G Final.pdf (file) | 285 KB | Beiko | 1 | ||
| 14:29, 14 May 2009 | BestMovieEver.swf (file) | 9.51 MB | Dparks | 1 | ||
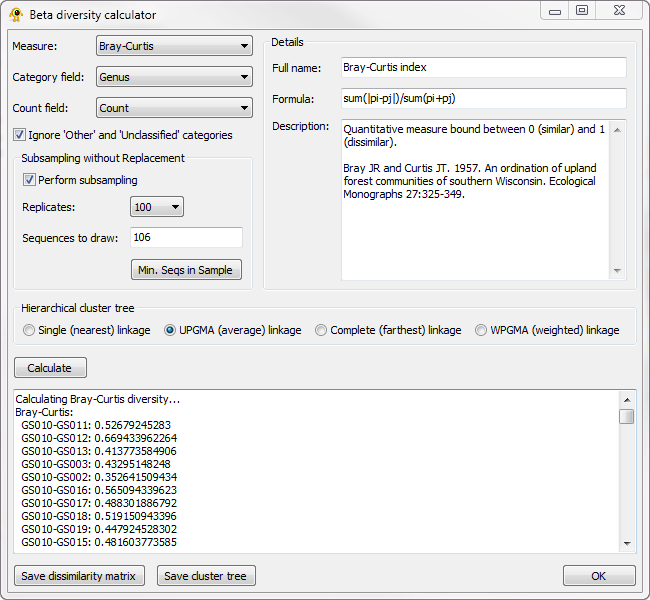
| 19:18, 27 July 2012 | BetaDiversityPlugin.png (file) |  |
60 KB | Dparks | Beta diversity plugin. | 1 |
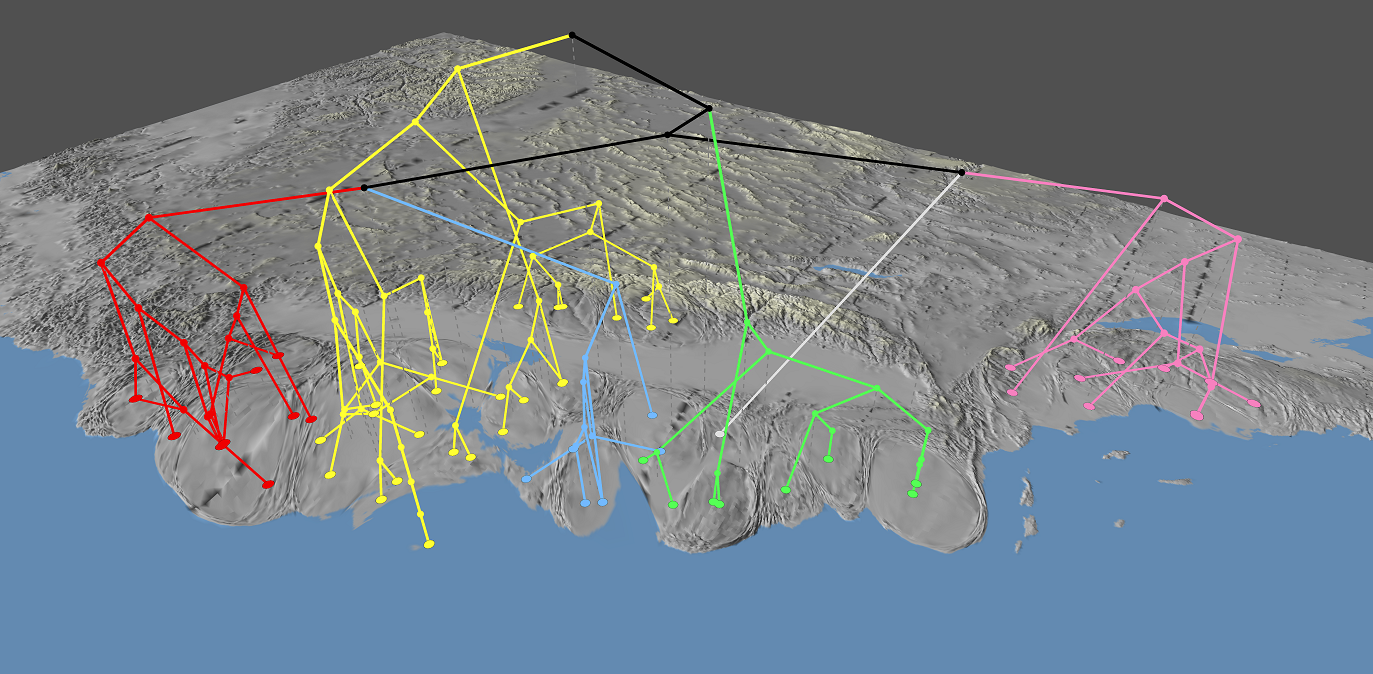
| 18:49, 7 August 2014 | Bio2.0.png (file) |  |
2.41 MB | Beiko | Pilot samples from the Biomonitoring 2.0 project | 1 |
| 14:24, 3 May 2009 | BlackLines.pdf (file) | 114 KB | Beiko | 1 | ||
| 13:23, 22 July 2013 | Calc.png (file) |  |
73 KB | Alex | 2 | |
| 00:22, 9 May 2009 | CaliSalamander.jpg (file) |  |
105 KB | Dparks | 1 | |
| 22:58, 4 May 2009 | CaliSalamander small.jpg (file) |  |
33 KB | Dparks | Ensatina eschscholtzii of the western United States. | 1 |
| 04:24, 4 May 2009 | CameraViewToolbar.jpg (file) |  |
3 KB | Dparks | 2 | |
| 17:54, 15 May 2016 | Cartogram.png (file) |  |
315 KB | Alex | 2 | |
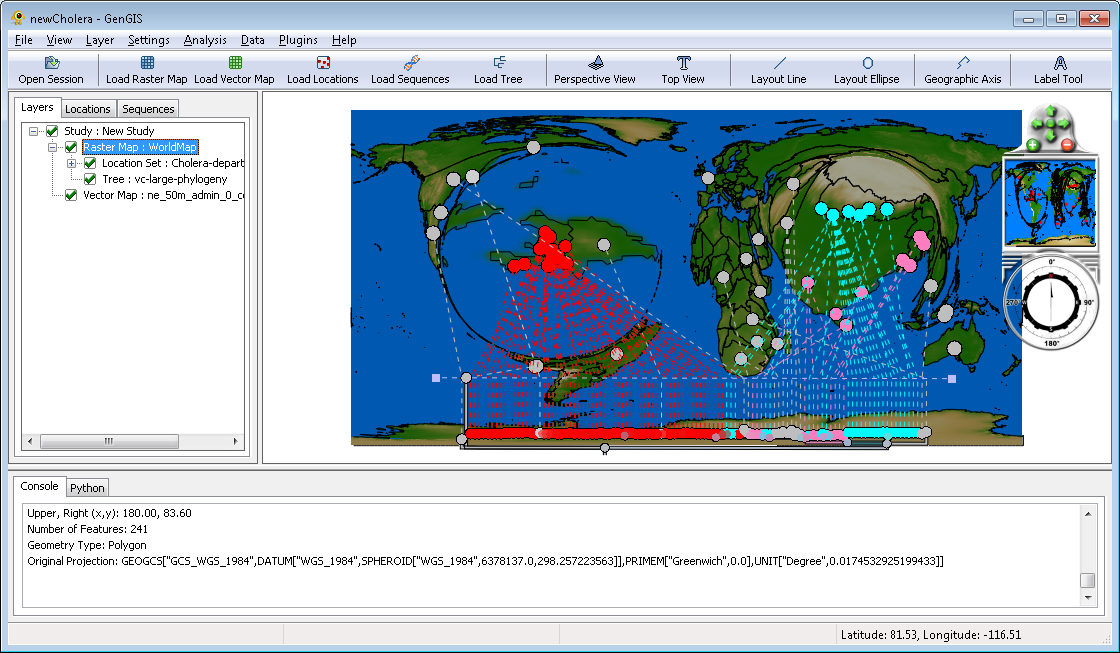
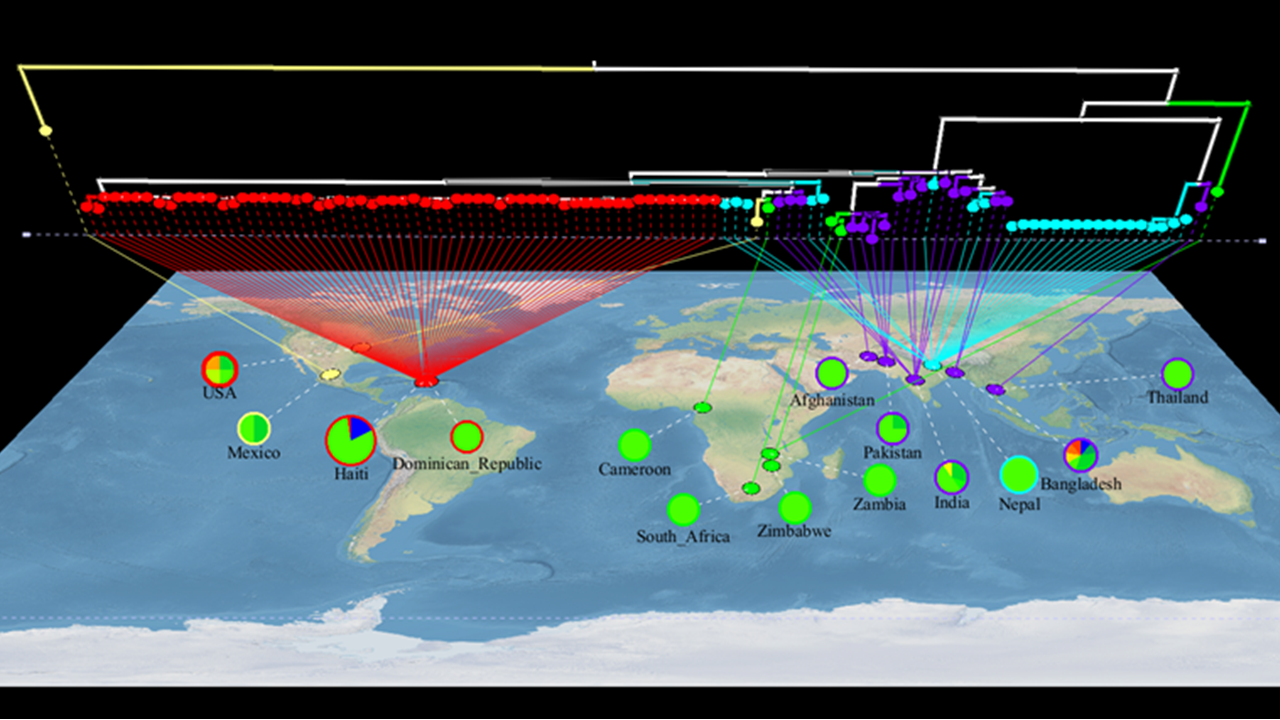
| 13:09, 7 August 2014 | Cholera.png (file) |  |
1.18 MB | Beiko | GenGIS image of Vibrio cholerae dataset showing single-source introduction to Haiti. Data from Katz et al. (2013) http://www.ncbi.nlm.nih.gov/pubmed/23820394 Samples from Nepal are coded in cyan, samples from Haiti are in red. Pie charts show the dis... | 1 |
| 14:05, 14 November 2014 | Collapse1.png (file) |  |
75 KB | Alex | 1 | |
| 14:05, 14 November 2014 | Collapse2.png (file) |  |
76 KB | Alex | 1 | |
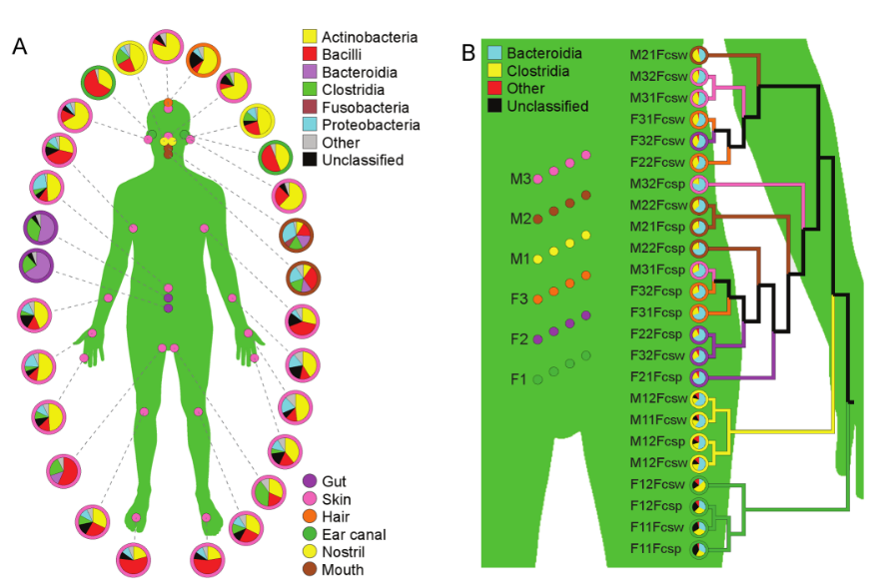
| 18:51, 7 August 2014 | Costello-body.png (file) |  |
317 KB | Beiko | Summary of taxonomic distributions of microbes at different body sites (A), and focused on the gut (B). Data from Costello et al. (2009): http://www.ncbi.nlm.nih.gov/pubmed/19892944 | 1 |
| 16:48, 18 June 2014 | DefaultView.png (file) |  |
26 KB | Alex | default view for show spread | 1 |
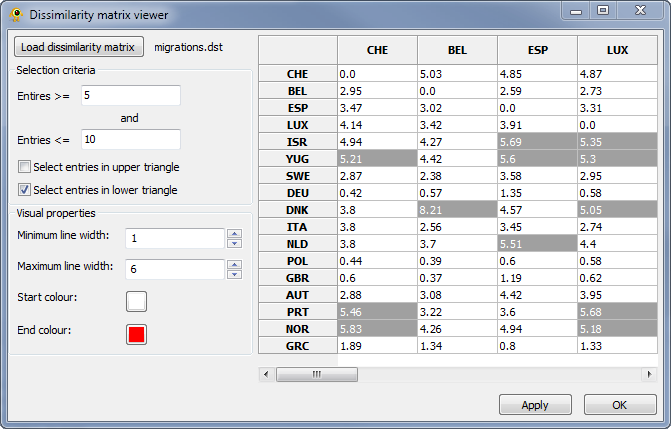
| 19:34, 4 March 2012 | DissimilarityMatrixViewer.png (file) |  |
51 KB | Dparks | 2 | |
| 15:37, 4 March 2012 | DissimilarityMatrixViewport.png (file) |  |
221 KB | Dparks | 1 | |
| 13:23, 22 July 2013 | Done.png (file) |  |
143 KB | Alex | 2 | |
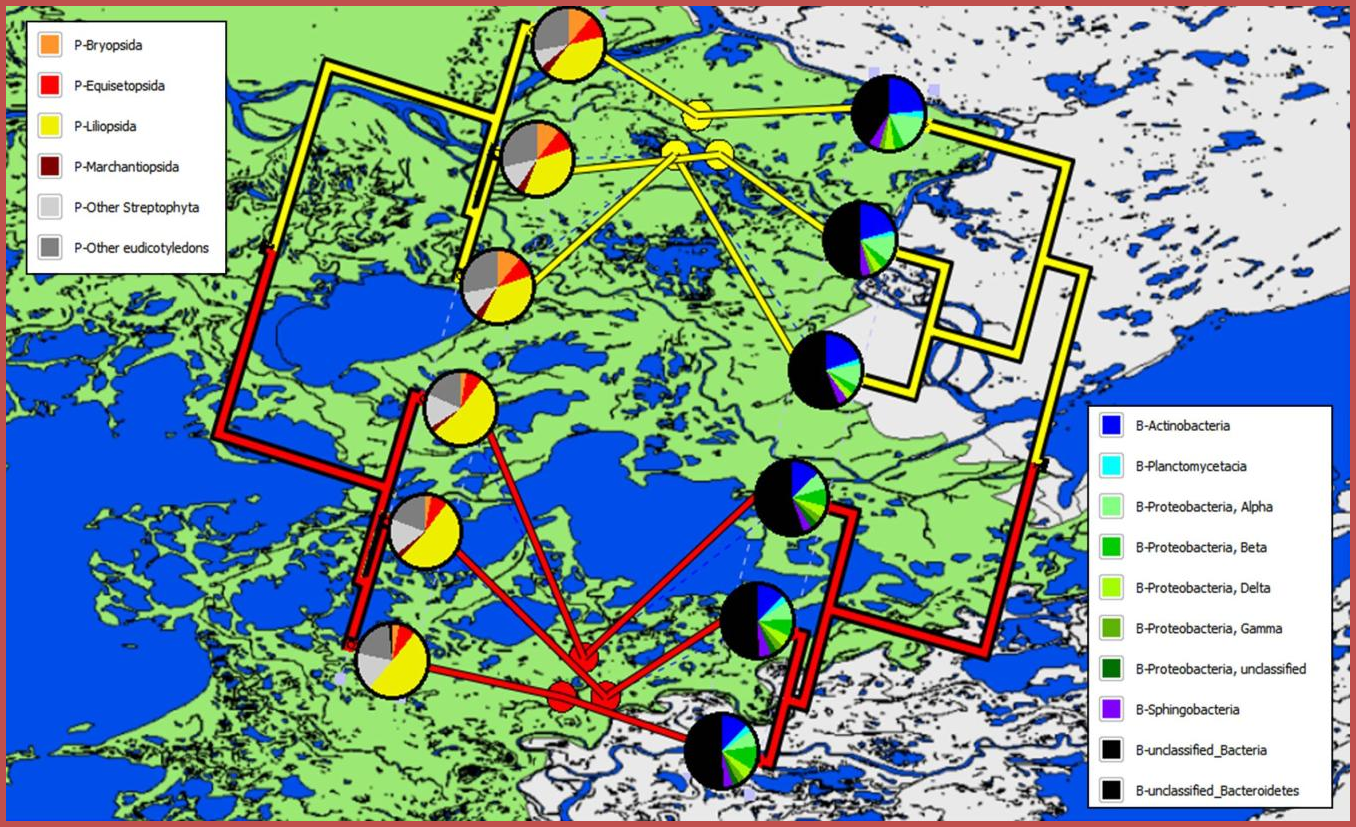
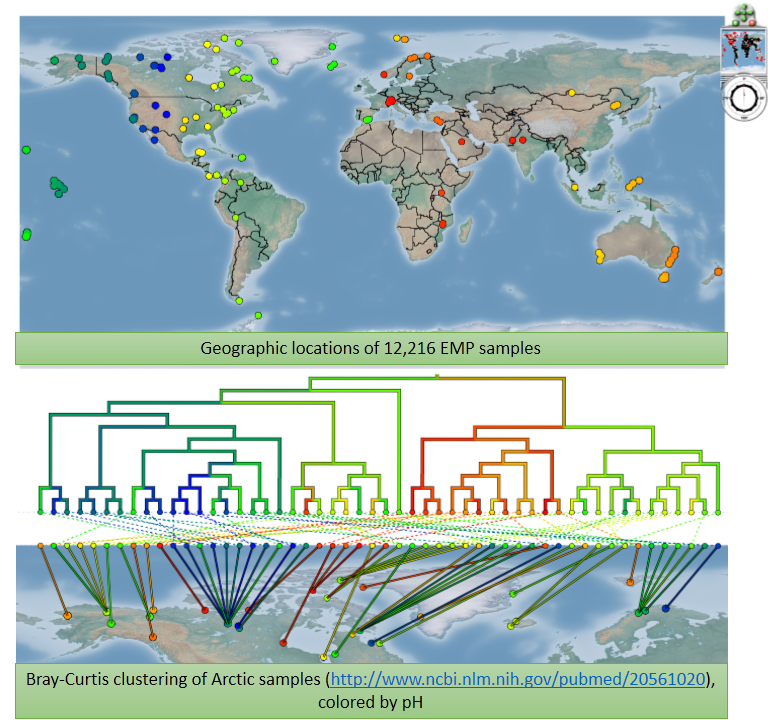
| 18:59, 7 August 2014 | EMP figs.png (file) |  |
701 KB | Beiko | Figures showing all samples available through the Earth Microbiome Project, and clustering of Arctic sites by pH (data from http://www.ncbi.nlm.nih.gov/pubmed/20561020) | 1 |
| 18:31, 6 August 2013 | EnvBarPlots.jpg (file) |  |
395 KB | Beiko | 1 | |
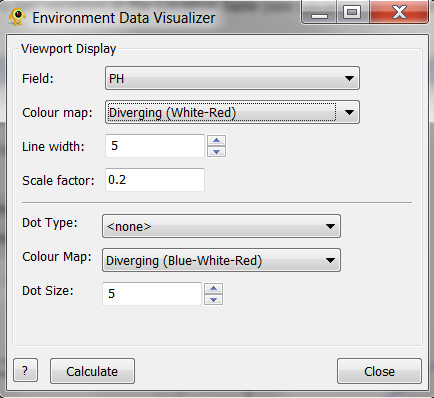
| 18:29, 6 August 2013 | EnvDataPlugin.jpg (file) |  |
44 KB | Beiko | 1 | |
| 19:42, 23 May 2009 | Europe.zip (file) | 1.76 MB | Dparks | Europe ASCII grid. | 1 | |
| 18:06, 28 May 2009 | EuropeHIV.zip (file) | 1.77 MB | Dparks | Data for visualizing mobility rates of HIV-1 subtype B in Europe recently reported by Paraskevis et al. (2009). | 2 | |
| 15:47, 22 May 2009 | ExpressInstall.swf (file) | 773 bytes | Dparks | 1 | ||
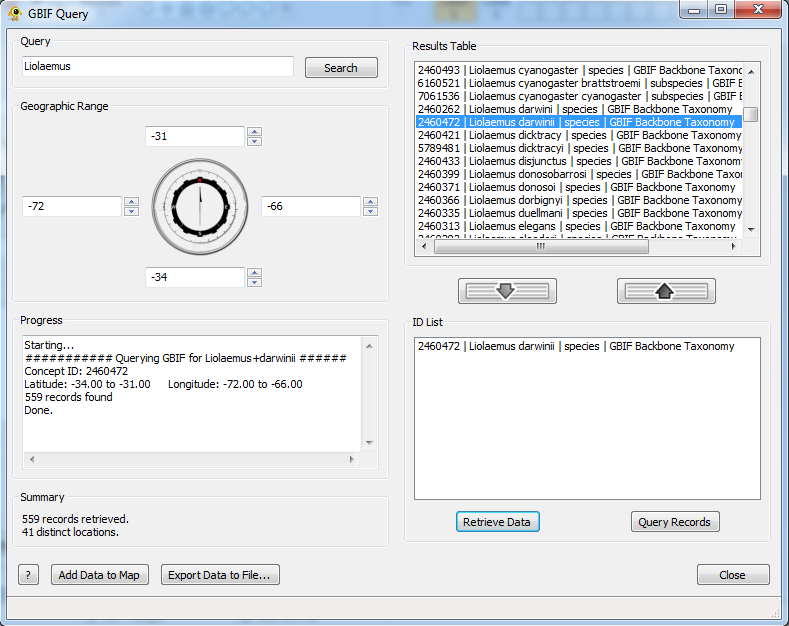
| 13:48, 8 August 2013 | GBIF x264.mp4 (file) | 60.03 MB | Beiko | 1 | ||
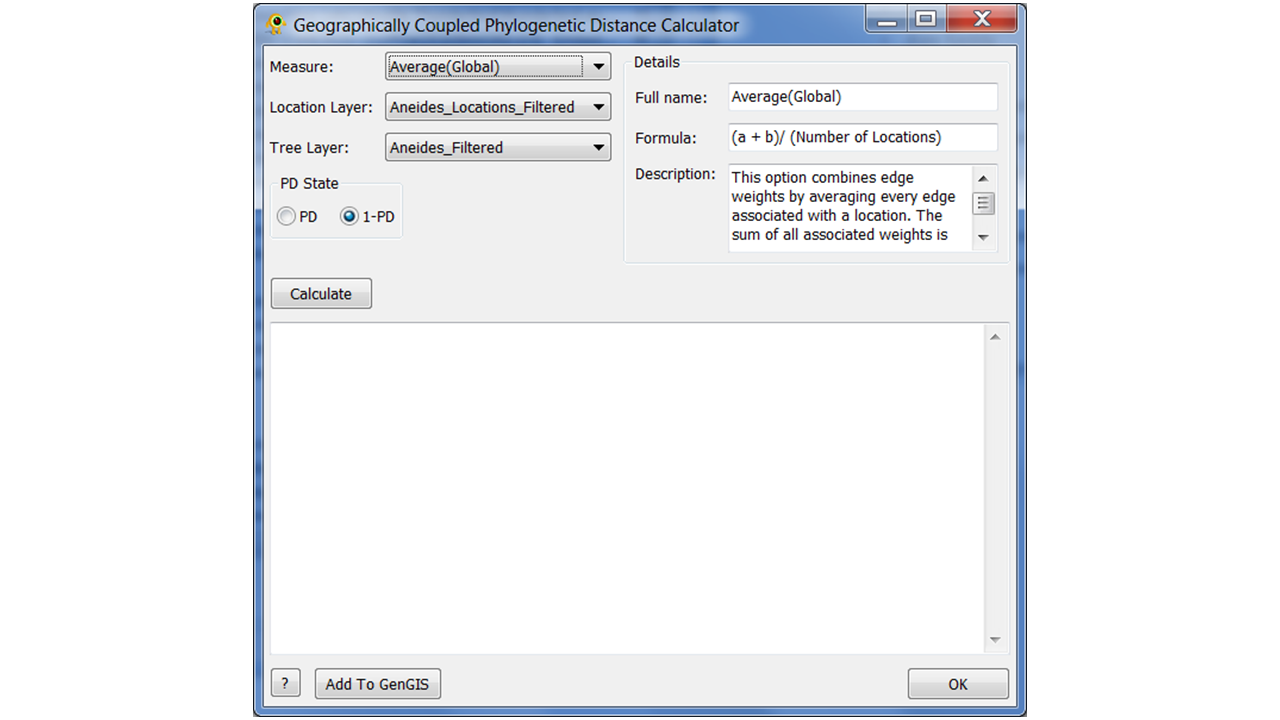
| 20:38, 19 May 2017 | GCPDSlide1.PNG (file) |  |
232 KB | Beiko | 1 | |
| 20:38, 19 May 2017 | GCPDSlide2.PNG (file) |  |
743 KB | Beiko | 1 | |
| 20:38, 19 May 2017 | GCPDSlide3.PNG (file) |  |
857 KB | Beiko | 1 | |
| 00:26, 15 April 2013 | GOS1-MatCorr.png (file) |  |
763 KB | Beiko | CCA Matrix Correlation | 1 |
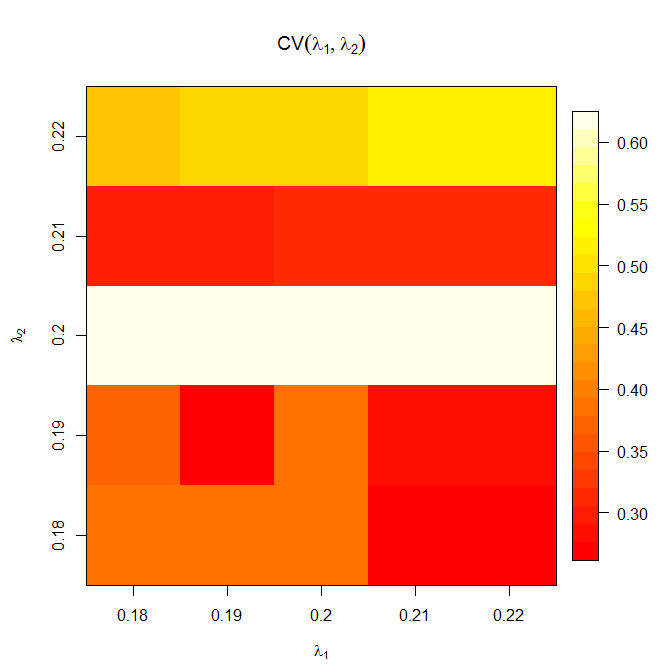
| 00:27, 15 April 2013 | GOS2-GridSearch.png (file) |  |
7 KB | Beiko | CCA Grid Search | 1 |
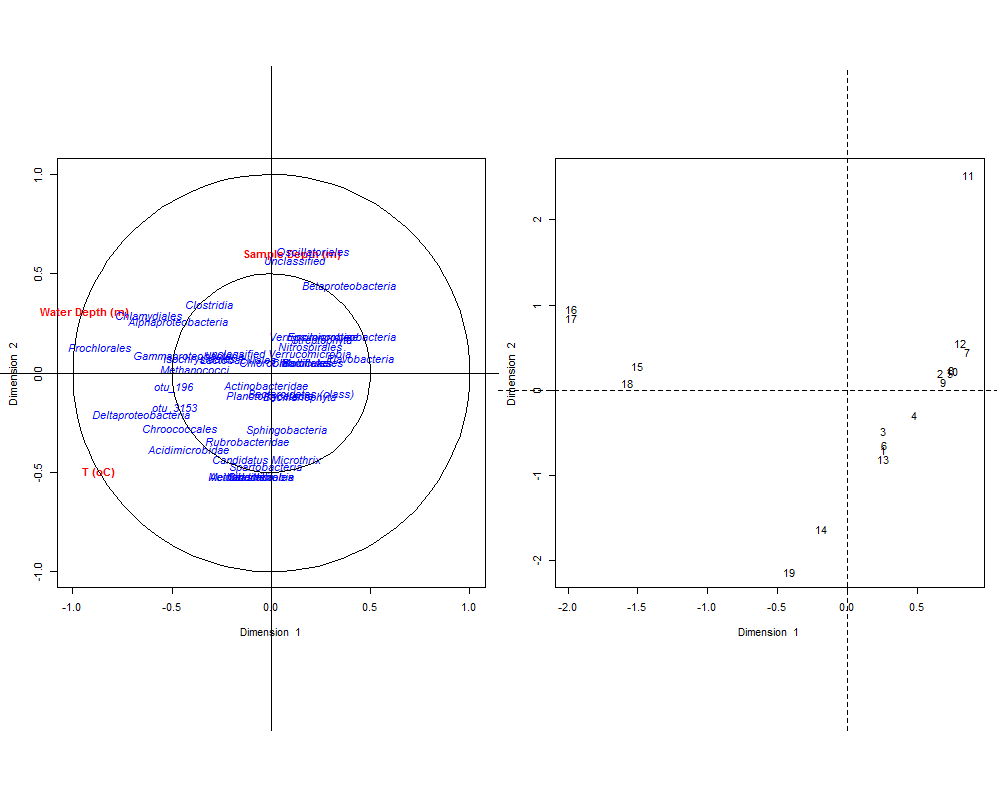
| 00:27, 15 April 2013 | GOS3-CCA.png (file) |  |
32 KB | Beiko | CCA CCA | 1 |
| 00:28, 15 April 2013 | GOS4-PENnetwork.png (file) |  |
32 KB | Beiko | CCA PEN | 1 |