Difference between revisions of "Main Page"
From Bioinformatics Software
Jump to navigationJump to search| Line 1: | Line 1: | ||
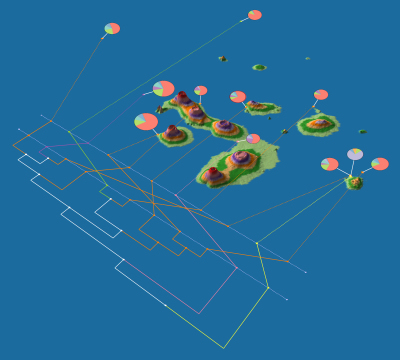
| + | [[Image:GenGIS_galapagos.jpg|frame|right|Using GenGIS to investigate the distribution of photorhodopsin genes around the Galapagos Islands (data courtesy of <Rob... who did we get this data from - Adrian?>).]] | ||
| + | |||
Welcome to the Bioinformatics Software and Resources page. | Welcome to the Bioinformatics Software and Resources page. | ||
| Line 5: | Line 7: | ||
== Software == | == Software == | ||
| − | |||
* [http://kiwi.cs.dal.ca/GenGIS GenGIS]: an application that allows users to combine digital map data with information about biological sequences collected from the environment. GenGIS provides a 3D graphical interface in which the user can navigate and explore the data, as well as a Python interface that allows easy scripting of statistical analyses using the Rpy libraries. | * [http://kiwi.cs.dal.ca/GenGIS GenGIS]: an application that allows users to combine digital map data with information about biological sequences collected from the environment. GenGIS provides a 3D graphical interface in which the user can navigate and explore the data, as well as a Python interface that allows easy scripting of statistical analyses using the Rpy libraries. | ||
Revision as of 21:55, 16 November 2009
Welcome to the Bioinformatics Software and Resources page.
<-- Can someone come up with a logo?
Software
- GenGIS: an application that allows users to combine digital map data with information about biological sequences collected from the environment. GenGIS provides a 3D graphical interface in which the user can navigate and explore the data, as well as a Python interface that allows easy scripting of statistical analyses using the Rpy libraries.
- Radié: a tool that allows characters to be visualized against the background of a phylogenetic tree. The software includes several different visual and numeric representations of the ‘convexity’ of a given character, in other words the extent to which different character traits form distinct groups within the tree.
- STAMP:
Web Services
- SeqMontior
- MOA (to be added)
- Visual MOA (to be added)
- MANUEL (to be added)
