Difference between revisions of "STAMP image gallery"
From Bioinformatics Software
Jump to navigationJump to search| Line 5: | Line 5: | ||
Image:IronMineSequenceHistogram.png|Sequence histogram for a pair of iron mine metagenomes (data described in [http://www.ncbi.nlm.nih.gov/pubmed/16549033 Edwards et al., 2006]). | Image:IronMineSequenceHistogram.png|Sequence histogram for a pair of iron mine metagenomes (data described in [http://www.ncbi.nlm.nih.gov/pubmed/16549033 Edwards et al., 2006]). | ||
Image:MultipleComparisonPlots StoreyFDR.png|Multiple comparison plots for assessing the results of Storey's false discovery rate method (see [http://www.ncbi.nlm.nih.gov/pubmed/19033188 Leek and Storey, 2008]). | Image:MultipleComparisonPlots StoreyFDR.png|Multiple comparison plots for assessing the results of Storey's false discovery rate method (see [http://www.ncbi.nlm.nih.gov/pubmed/19033188 Leek and Storey, 2008]). | ||
| + | Image:IronMine pValueHistogram.png|p-value histogram for a pair of iron mine metagenomes (data described in [http://www.ncbi.nlm.nih.gov/pubmed/16549033 Edwards et al., 2006]). | ||
</gallery> | </gallery> | ||
Revision as of 00:52, 22 November 2009
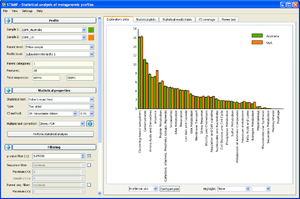
Screen capture of STAMP v1.0.
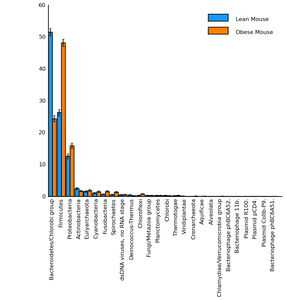
Taxonomy profile plot for an obese and lean mouse microbiome (data described in Turnbaugh et al., 2006).
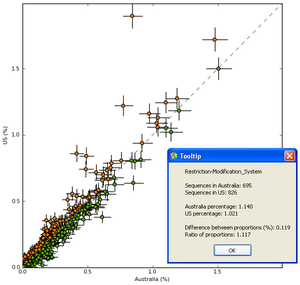
SEED subsystem scatter plot for a pair of enhanced biological phosphorus removal (EBPR) sludge metagenomes (data described in Martín et al., 2006).
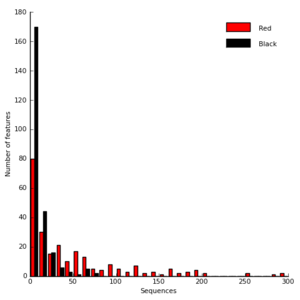
Sequence histogram for a pair of iron mine metagenomes (data described in Edwards et al., 2006).
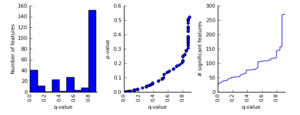
Multiple comparison plots for assessing the results of Storey's false discovery rate method (see Leek and Storey, 2008).
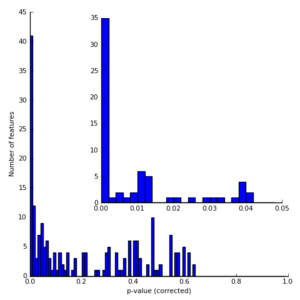
p-value histogram for a pair of iron mine metagenomes (data described in Edwards et al., 2006).


