Difference between revisions of "STAMP image gallery"
From Bioinformatics Software
Jump to navigationJump to search| Line 1: | Line 1: | ||
| − | |||
| − | |||
| − | |||
| − | |||
| − | |||
| − | |||
<gallery widths="300px" heights="300px" perrow="3"> | <gallery widths="300px" heights="300px" perrow="3"> | ||
Image:STAMP_Screenshot.png|Screen capture of STAMP v1.0. | Image:STAMP_Screenshot.png|Screen capture of STAMP v1.0. | ||
Revision as of 00:47, 22 November 2009
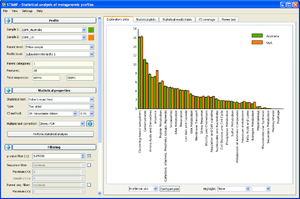
Screen capture of STAMP v1.0.
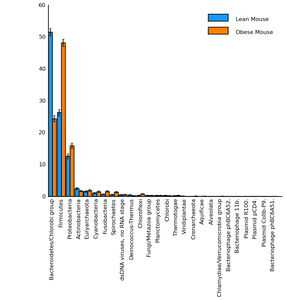
Taxonomy profile plot for an obese and lean mouse microbiome (data described in Turnbaugh et al., 2006).
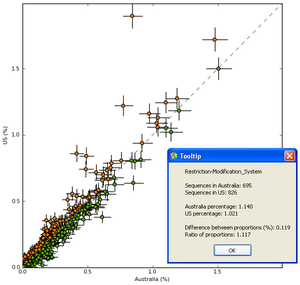
SEED subsystem scatter plot for a pair of enhanced biological phosphorus removal (EBPR) sludge metagenomes (data described in Martín et al., 2006).
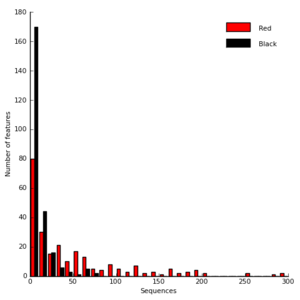
Sequence histogram for a pair of iron mine metagenomes (data described in Edwards et al., 2006).
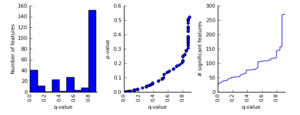
Multiple comparison plots for assessing the results of Storey's false discovery rate method (see Leek and Storey, 2008).


