Difference between revisions of "Main Page"
| Line 19: | Line 19: | ||
* (May 28, 2009) Demonstration of using GenGIS to visualize the mobility rates of HIV-1 subtype B in Europe as proposed by Paraskevis et al. (2009) has been added to the [[Gallery|example gallery]]. | * (May 28, 2009) Demonstration of using GenGIS to visualize the mobility rates of HIV-1 subtype B in Europe as proposed by Paraskevis et al. (2009) has been added to the [[Gallery|example gallery]]. | ||
| − | * (May 24, 2009) A video showing the spread of the 2009 H1N1 influenza outbreak has been added to the [[H1N1|H1N1 outbreak]] example. | + | * (May 24, 2009) A video showing the spread of the 2009 H1N1 influenza outbreak has been added to the [[H1N1#Videos|H1N1 outbreak]] example. |
=== Examples === | === Examples === | ||
Revision as of 19:07, 28 May 2009
Contents
GenGIS
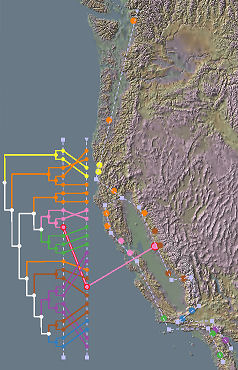
GenGIS is a bioinformatics application that allows users to combine digital map data with information about biological sequences collected from the environment. GenGIS provides a 3D graphical interface in which the user can navigate and explore the data, as well as a Python interface that allows easy scripting of statistical analyses using the Rpy libraries.
GenGIS version 1.0 is now available! Below you can find information about the software, data sources, tutorials, and the manual. The manual is still under development, but the tutorials give a good overview of how to use the software.
From here you can:
Visit the documentation page (Tutorials, manual, FAQ's)
See our list of links for data and application support
Announcements
- (May 28, 2009) Demonstration of using GenGIS to visualize the mobility rates of HIV-1 subtype B in Europe as proposed by Paraskevis et al. (2009) has been added to the example gallery.
- (May 24, 2009) A video showing the spread of the 2009 H1N1 influenza outbreak has been added to the H1N1 outbreak example.
Examples
We are building a gallery of example applications using GenGIS, including tracking of the current H1N1 outbreak and the spread of HIV-1 subtype B in Europe.
Citing GenGIS
Please cite GenGIS if you use it in your work. Currently the best citation for GenGIS is:
Beiko, R., Whalley, J., Wang, S., Clair, H., Smolyn, G., Churcher, S., Porter, M., Blouin, C., & Brooks, S. (2008). Spatial analysis and visualization of genetic biodiversity. Free and Open Source Software for Geospatial (FOSS4G), Cape Town, South Africa (September-October 2008). (Abstract) (Full Paper)
Other papers and conference proceedings related to GenGIS:
- Parks, D.H. and Beiko, R.G. (2009). Quantitative visualizations of hierarchically organized data in a geographic context. Accepted to Geoinformatics 2009, Fairfax, VA.
- Parks, D.H., Porter, M., Churcher, S., Wang, S., Blouin, C., Whalley, J., Brooks, S. and Beiko, R.G. GenGIS: A geospatial information system for genomic data. Currently submitted to Genome Research. This will become the main GenGIS reference when it is accepted by a journal.
- Wang, S., Beiko, R.G., & Brooks, S. (2007). Collapsible 3D Terrains for GIS Visualization. Geovisualization, NUI Maynooth (September 2007). (Full Paper)
Contact Information
GenGIS is in active development and we are interested in discussing all potential applications of this software. We encourage you to send us suggestions for new features. Suggestions, comments, and bug reports can be sent to Rob Beiko (beiko [at] cs.dal.ca). If reporting a bug, please provide as much information as possible and a simplified version of the data set which causes the bug. This will allow us to quickly resolve the issue.
Funding of GenGIS
The development and deployment of GenGIS has been supported by several organizations:
- Genome Atlantic
- The Dalhousie Centre for Comparative Genomics and Evolutionary Bioinformatics, and the Tula Foundation
- The Natural Sciences and Engineering Research Council of Canada
- The Dalhousie Faculty of Computer Science
