H1N1
Contents
Tracking the Evolution and Spread of the 2009 Influenza A H1N1 'Swine Flu' Outbreak
The current swine flu outbreak is being tracked in many different ways. News reports are being aggregated into an overall geographic story about the spread of the virus: see for example the Rhiza Labs page and this Google Maps mashup.
In addition to the tracking of news reports, sequence data are being released at NCBI and GISAID. These data are being tracked and subjected to cutting-edge molecular analysis at the Human/Swine A/H1N1 Influenza Origins and Evolution site.
On this page, we show how GenGIS can be used to examine the geographic spread and evolutionary relationships of the strains and isolates that have been collected to date. We have written scripts to parse the Rhiza Labs data and show geographical distributions during different phases (defined by us, and based solely on data availability) of the outbreak. Beyond this, we are using automated methods to retrieve sequence data from NCBI, build multiple sequence alignments, construct phylogenetic trees and then map them using GenGIS.
Caveats
There are some important limitations to keep in mind when interpreting these data sets:
- Date and location assignments are approximate; in some cases complete geographic and time information is not available about a particular isolate. In addition to this, the time lag between initial infection, onset of symptoms, collection of sequence data and reporting of the case in the media will vary.
- The reported cases are an incomplete and non-random subset of all cases, given that many mild cases may not be reported at all or may be misdiagnosed. Furthermore, the sequenced isolates are a non-random sample of reported cases. The impact of this non-random subsampling will be particularly strong in Mexico, where most of the genetic diversity of this strain is likely to be found. This means that, for example, two disparate non-Mexico sites that group together in a tree could very well do so because of a common Mexican origin, rather than a direct spread from one location to the other.
- Online data are being parsed semi-automatically; obvious mistakes are corrected (typically removed) prior to analysis, but more-subtle errors will creep through.
Videos
- Stream (32.0 MB) a short video showing geographic relationships among sequenced H1N1 HA sequences. This is an edited version of the full video below.
- Stream or download (51.0 MB) video showing the geophylogeny of the HA segment during the 2009 H1N1 influenza outbreak. This video is more detailed and intended for potential users of GenGIS.
- Stream or download (18.6 MB) video showing the spread of polymorphic amino acid sites during the 2009 H1N1 influenza outbreak.
- Stream or download (14 MB) video showing the spread of the 2009 H1N1 influenza outbreak.
Confirmed Cases
Confirmed case information is currently being extracted from the Rhiza Labs .csv file at this location. Note the data are licensed under a Creative Commons Attribution-Noncommercial-Share Alike 3.0 United States License.
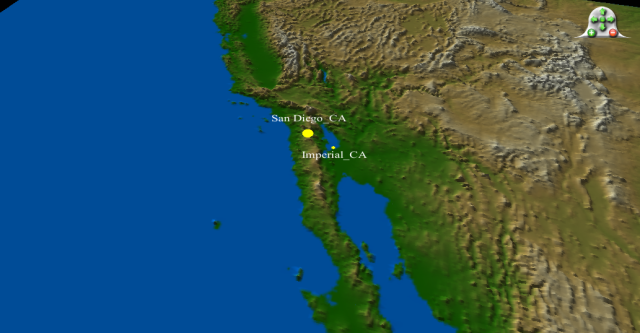
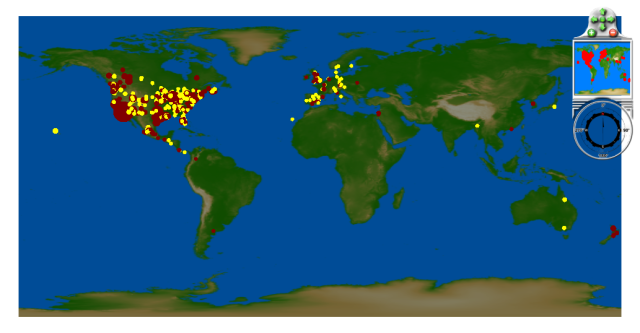
Late March: confirmed cases in Southern California:
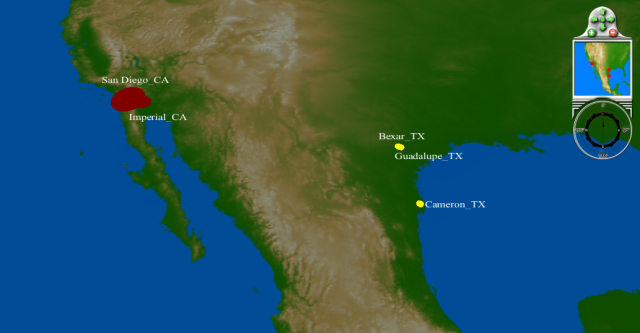
April 1 - 15: more cases in Southern California, confirmed cases in Texas:
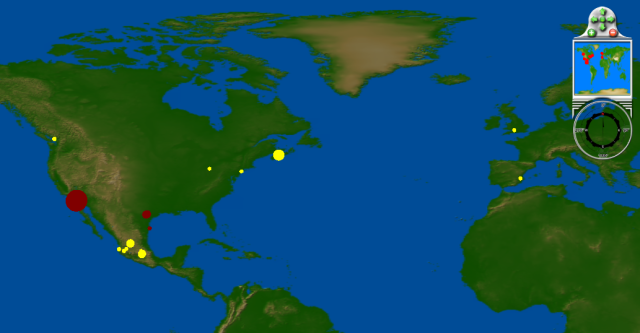
April 16 - 26: more cases in U.S. Southwest, confirmed cases in Mexico, Canada, Spain and the UK:
April 27 - May 3: First confirmed cases in Asia, Israel, New Zealand; rapid spread in North America:
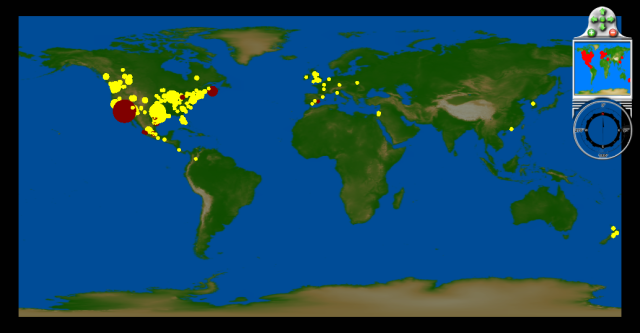
May 4 - May 9: First confirmed cases in Australia, Japan, South Asia, and several more European countries:
Geophylogenies
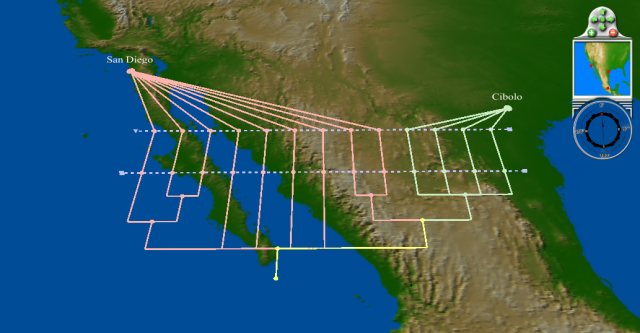
Phylogenetic tree of hemagglutinin sequences as of April 15, showing similar (in fact, identical) Texas sequences and the diversity of sequences collected from San Diego:
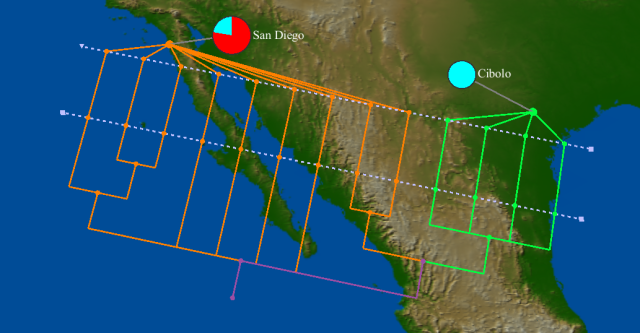
Same tree, with pie charts showing the nucleotide residue at HA position 297 (red = C; cyan = T):
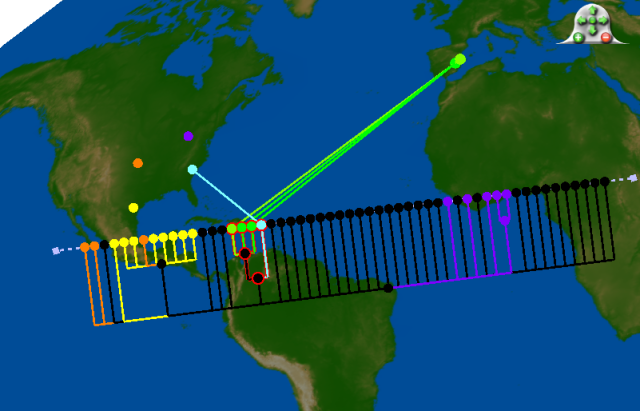
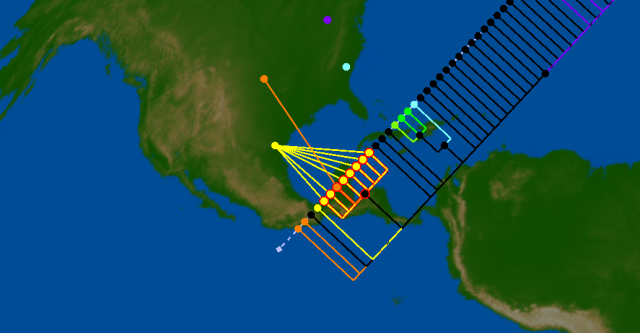
HA tree as of April 26, showing three significant clusters of sequences: Ohio (purple), Texas / Kansas (yellow and orange), and South Carolina / Spain (cyan and green; highlighted in image):
Same tree, with Texas / Kansas cluster highlighted:
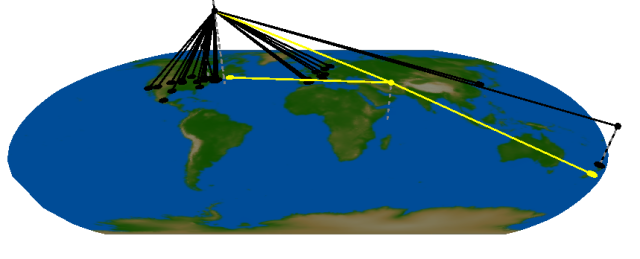
Three-dimensional neuraminidase (NA gene) tree as of May 3, showing near-complete lack of resolution, and with Christchurch / Windsor pairing highlighted:
Credits
Norm MacDonald has been instrumental in writing the scripts that automatically acquire, align and build trees from the emerging H1N1 sequences. Although we have prototyped GenGIS using several different types of genetic and genomic data, the H1N1 anaysis was out first intensive use case for GenGIS. Donovan Parks has provided on-the-fly bug fixes and enhancements to support the visualizations shown above.
Contact: beiko [at] cs.dal.ca
