Difference between revisions of "Gallery"
From The GenGIS wiki
Jump to navigationJump to search| Line 14: | Line 14: | ||
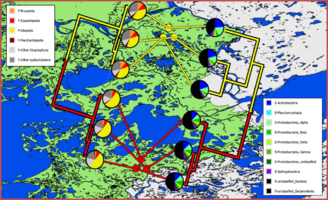
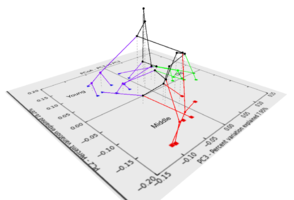
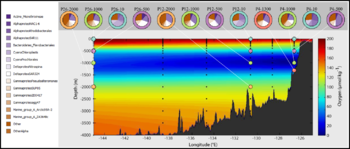
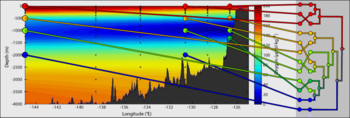
File:Sup05-1.png|<center>Diversity of microbial profiles across a linear transect and by depth.</center> | File:Sup05-1.png|<center>Diversity of microbial profiles across a linear transect and by depth.</center> | ||
File:Sup05-2.png|<center>Clustering of microbial samples by depth and transect location.</center> | File:Sup05-2.png|<center>Clustering of microbial samples by depth and transect location.</center> | ||
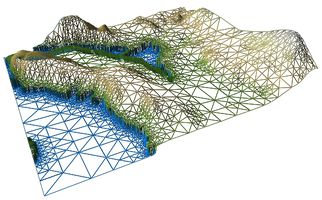
| + | File:WireframeDEM.jpg|<center>Wireframe view of the Sydney Tar Ponds.</center> | ||
</gallery> | </gallery> | ||
Revision as of 00:12, 8 August 2014
Images
Datasets
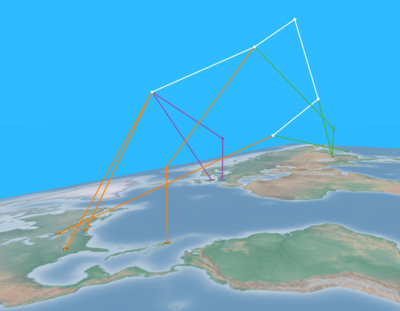
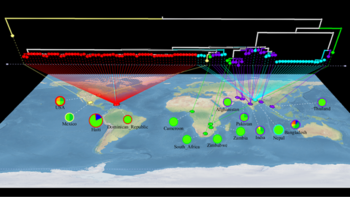
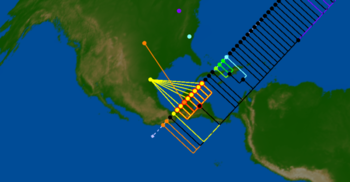
Intermingling of 2009 H1N1 isolates from different continents provides strong evidence of the global nature of this pandemic (Parks et al., 2009).
H1N1 outbreak - GenGIS is being used to examine the geographic spread and evolutionary relationships of the swine flu strains and isolates that have been collected to date.
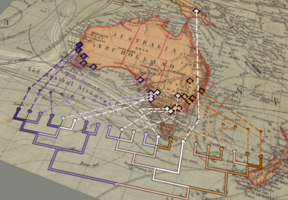
HIV-1 subtype B in Europe - Here we show how GenGIS can be used to visualize the results of Paraskevis et al. (2009) which proposed mobility rates of HIV-1 subtype B in Europe.
