Difference between revisions of "Gallery"
From The GenGIS wiki
Jump to navigationJump to search| Line 1: | Line 1: | ||
| + | == Images == | ||
| + | |||
| + | |||
| + | |||
| + | |||
| + | == Datasets == | ||
| + | |||
[[Image:H1N1_panmixia.png|thumb|right|400px|Intermingling of 2009 H1N1 isolates from different continents provides strong evidence of the global nature of this pandemic ([http://knol.google.com/k/tracking-the-evolution-and-geographic-spread-of-influenza-a?collectionId=28qm4w0q65e4w.1&position=2# Parks et al., 2009]).]] | [[Image:H1N1_panmixia.png|thumb|right|400px|Intermingling of 2009 H1N1 isolates from different continents provides strong evidence of the global nature of this pandemic ([http://knol.google.com/k/tracking-the-evolution-and-geographic-spread-of-influenza-a?collectionId=28qm4w0q65e4w.1&position=2# Parks et al., 2009]).]] | ||
Revision as of 13:02, 7 August 2014
Images
Datasets

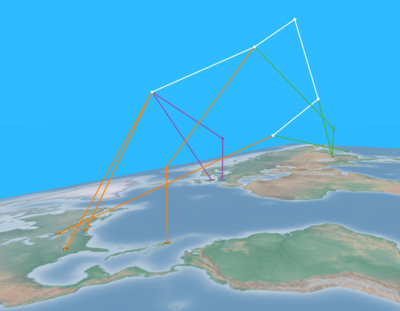
Intermingling of 2009 H1N1 isolates from different continents provides strong evidence of the global nature of this pandemic (Parks et al., 2009).
H1N1 outbreak - GenGIS is being used to examine the geographic spread and evolutionary relationships of the swine flu strains and isolates that have been collected to date.
HIV-1 subtype B in Europe - Here we show how GenGIS can be used to visualize the results of Paraskevis et al. (2009) which proposed mobility rates of HIV-1 subtype B in Europe.