Difference between revisions of "Gallery"
From The GenGIS wiki
Jump to navigationJump to search| Line 14: | Line 14: | ||
File:Sup05-1.png|<center>Diversity of microbial profiles across a linear transect and by depth.</center> | File:Sup05-1.png|<center>Diversity of microbial profiles across a linear transect and by depth.</center> | ||
File:Sup05-2.png|<center>Clustering of microbial samples by depth and transect location.</center> | File:Sup05-2.png|<center>Clustering of microbial samples by depth and transect location.</center> | ||
| + | File:WireframeDEM.jpg|<center>Wireframe view of the Sydney Tar Ponds.</center> | ||
</gallery> | </gallery> | ||
Revision as of 00:12, 8 August 2014
Images
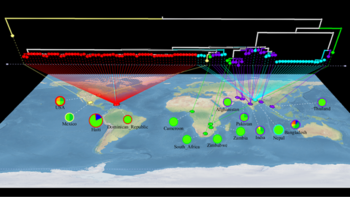
Transmission of Vibrio cholerae into Haiti. 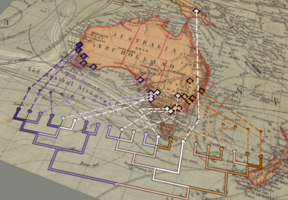
Kangaroo apple phylogeny. 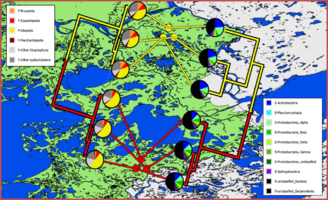
Similarity of plant and bacterial samples in Wood Buffalo National Park. 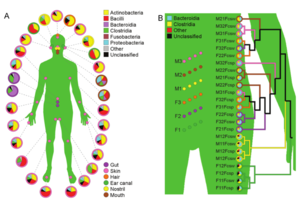
Two views of the human microbiome: across body sites, and gut samples across individuals and time points. 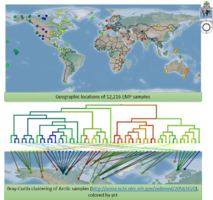
Earth Microbiome Project samples, and clustering of Arctic sites by pH. 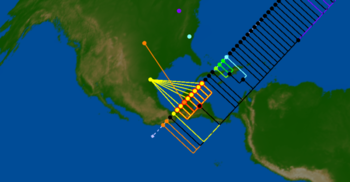
Early samples and geophylogeny of the 2009 H1N1 pandemic. 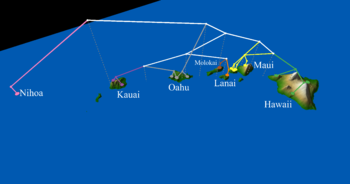
Geophylogeny of katydids in Hawai'i. 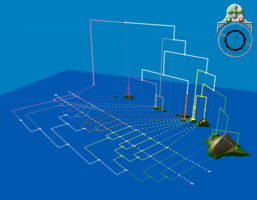
A different view of the katydid geophylogeny. 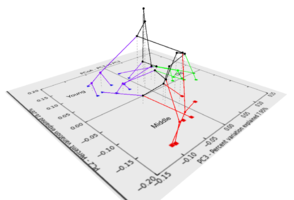
Overlaying a clustering of mouse samples onto an ordination plot. 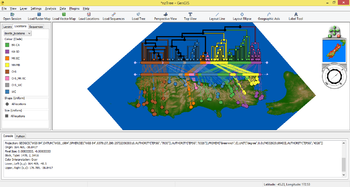
Geophylogeny of beetles in New Zealand. 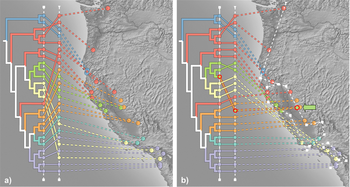
Contrasting hypotheses of geographic structuring of Ensatina salamanders. 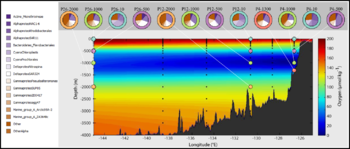
Diversity of microbial profiles across a linear transect and by depth. 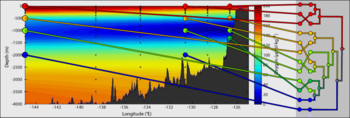
Clustering of microbial samples by depth and transect location. 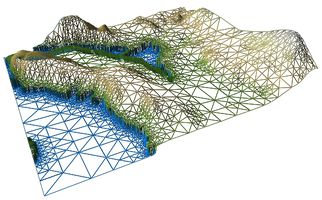
Wireframe view of the Sydney Tar Ponds.


Datasets

Intermingling of 2009 H1N1 isolates from different continents provides strong evidence of the global nature of this pandemic (Parks et al., 2009).
H1N1 outbreak - GenGIS is being used to examine the geographic spread and evolutionary relationships of the swine flu strains and isolates that have been collected to date.
HIV-1 subtype B in Europe - Here we show how GenGIS can be used to visualize the results of Paraskevis et al. (2009) which proposed mobility rates of HIV-1 subtype B in Europe.