RCA Tutorial
From The GenGIS wiki
Jump to navigationJump to searchContents
Introduction
- The Reference Condition Analysis plugin is used to evaluate impacts on biodiversity by computing the expected diversity based on several types of habitat metadata and compares these to the observed diversity.
- This tutorial outlines the use of the RCA plugin on a dataset from the Upper Mersey region in Nova Scotia, Canada.
- Download the RCA Tutorial files
Loading Data
- Unzip the download rca_tutorial.zip file from the link above.
- Launch GenGIS and load the following files:
- Merseyarea.tiff using Load Raster Map
- UpperMersey_locs.csv using Load Locations
- UpperMersey_seqs.csv using Load Sequences
Run RCA Plugin
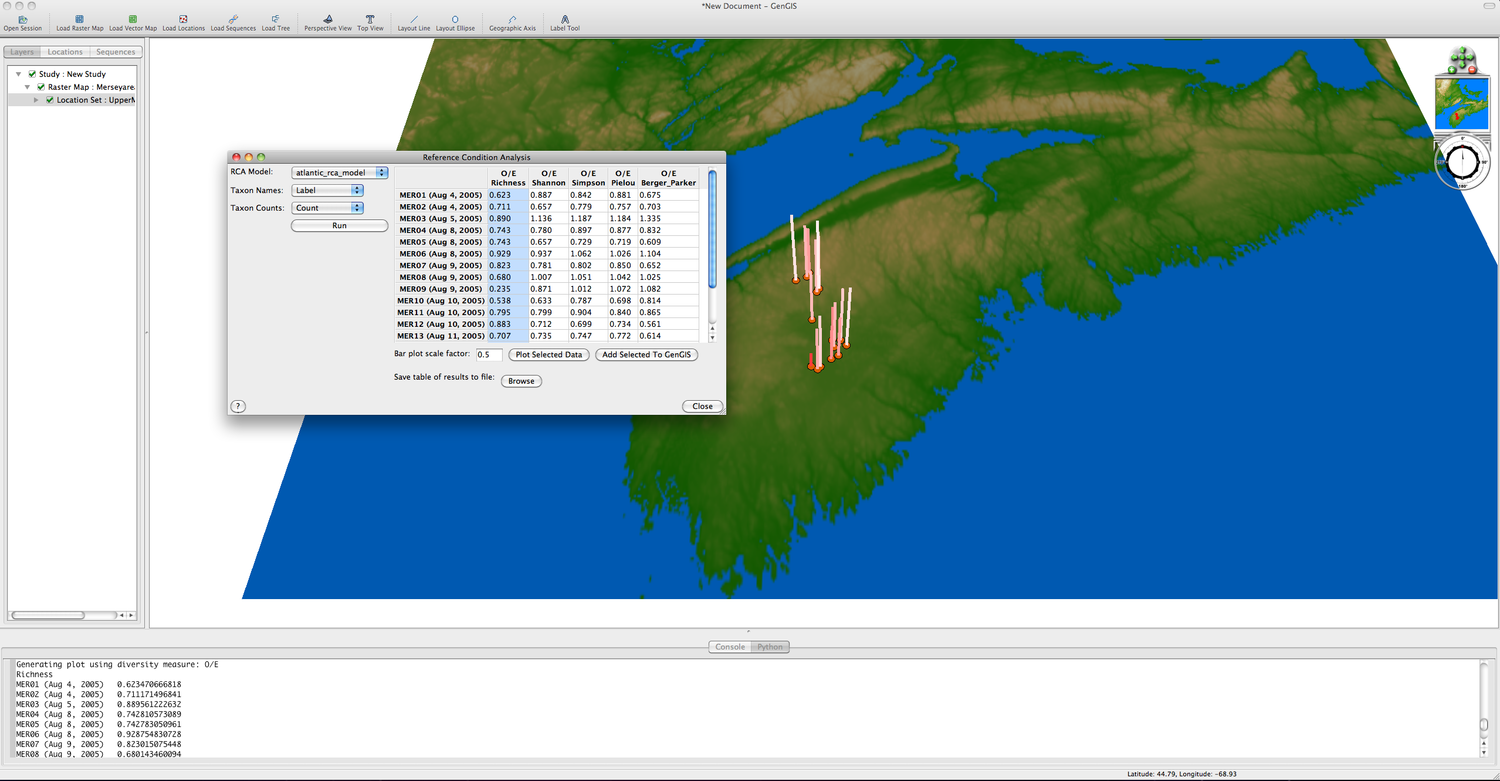
- Launch the RCA plugin Plugins->Reference Condition Analysis.
- Leave the default (and only) choice for RCA Model to atlantic_rca_model.
- Check that the Taxon Names box has Label selected (this contains the names of the taxa that were loaded with the sequence file).
- Check that the Taxon Counts box has Count selected (this contains the number of each taxa that were loaded with the sequence file).
- Click Run. Results should appear in table within a couple of seconds.
Visualizing Results
- The RCA plugin calculates various "expected" diversity measures using metadata ('clim_Trange', 'geo_intr', 'geo_sed', and 'geo_sedvol') from the location file and compares these to the "observed" diversity measures from the sequence data (taxa and counts).
- The RCA plugin reports in the table the ratio of "observed" diversity over the "expected" diversity (e.g. "O/E") for each of the different diversity measures (e.g. Shannon, Simpson, etc.).
- Each of the "O/E" diversity measures can be plotted as a bar plot on the GenGIS map by highlighting a column (e.g. O/E Richness) and clicking 'Plot Selected Data'. The height of the bars can be changed using the Bar plot scale factor (e.g. setting to a value of 0.5 will make the bars shorter).
Saving results to file
- The entire table can be saved as a comma delimited file (.csv) by clicking on the Save table of results to file: Browse button.
Using results with other plugins
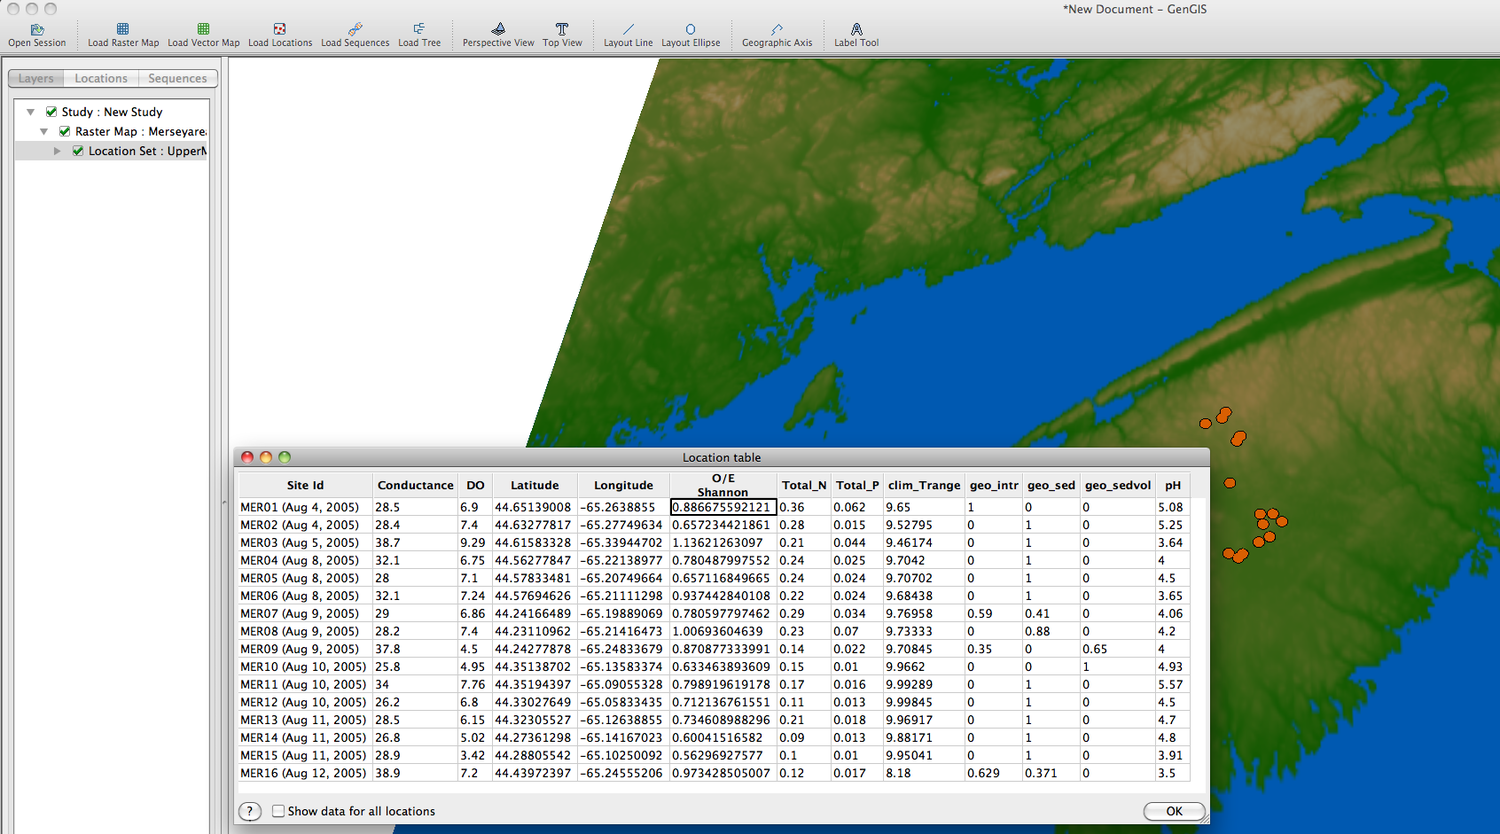
- Each of the columns (O/E diversity measures) can be added as location metadata for use by GenGIS and other plugins by clicking on one of the columns and clicking Add Selected To GenGIS.
- The new location metdata can be viewed by using Plugins->Location Table Viewer.
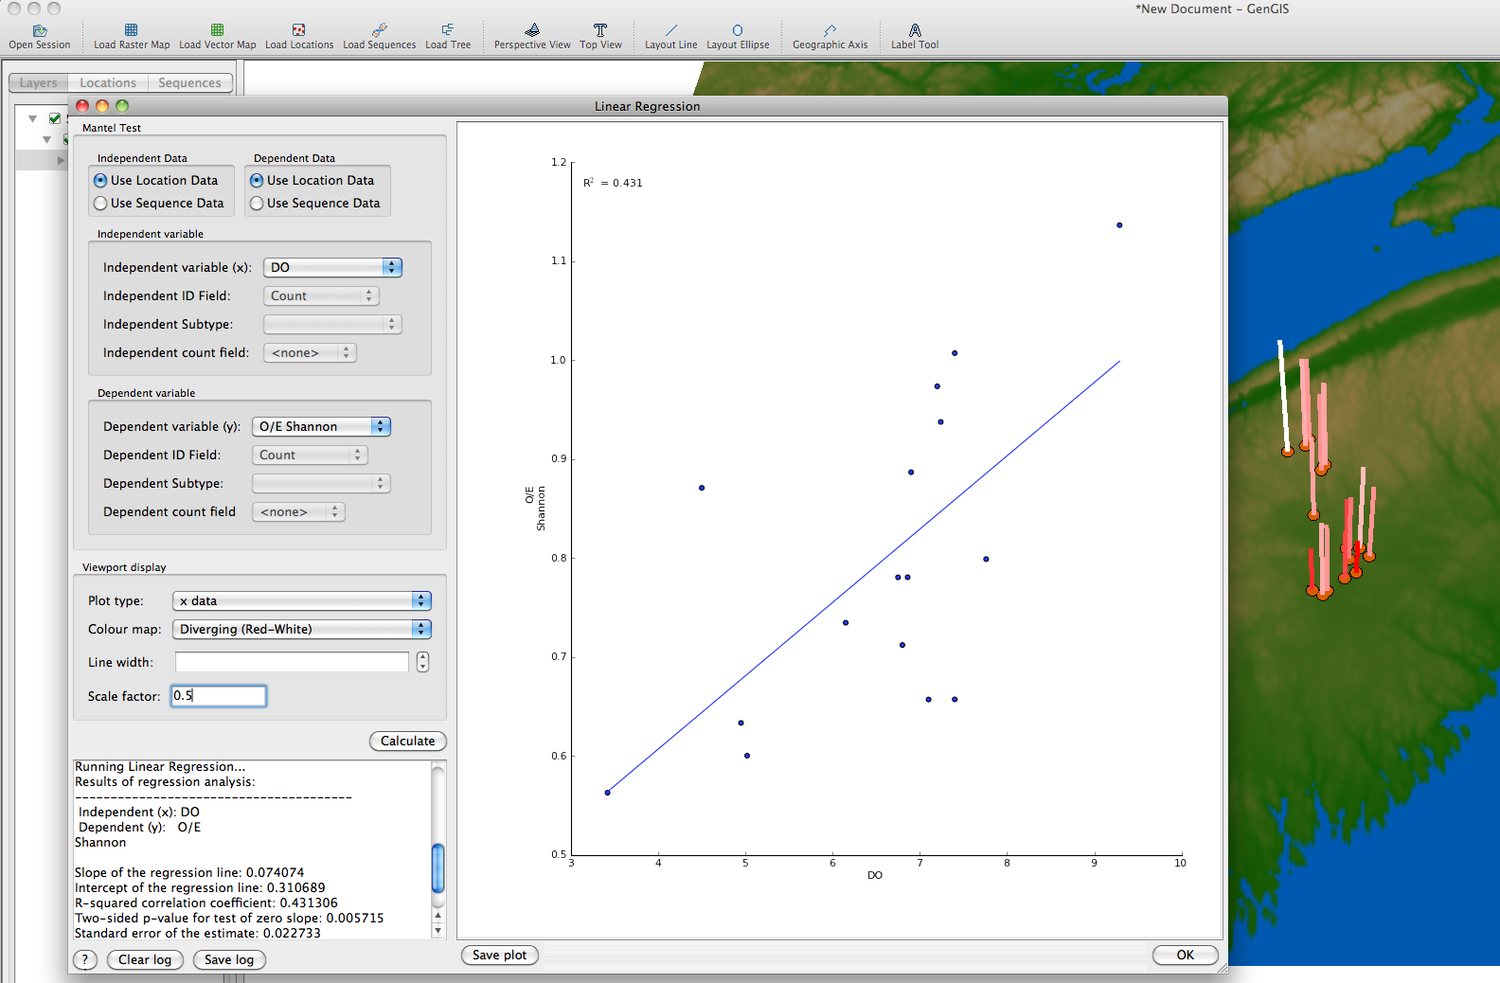
- Other plugins can be used with the RCA results as well such as Plugins->Linear Regression.
References
- D. G. Armanini, W. A. Monk, L. Carter, D. Cote & D. J. Baird "Towards generalised reference condition models for environmental assessment: a case study on rivers in Atlantic Canada" (2012) Environ Monit Assess. epub


