Uploads by Beiko
From The GenGIS wiki
Jump to navigationJump to searchThis special page shows all uploaded files.
| Date | Name | Thumbnail | Size | Description | Versions |
|---|---|---|---|---|---|
| 14:38, 19 May 2017 | GCPDSlide3.PNG (file) | 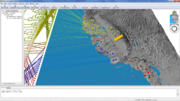 |
857 KB | 1 | |
| 14:38, 19 May 2017 | GCPDSlide2.PNG (file) | 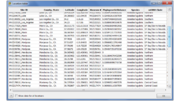 |
743 KB | 1 | |
| 14:38, 19 May 2017 | GCPDSlide1.PNG (file) | 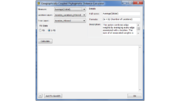 |
232 KB | 1 | |
| 09:57, 16 May 2017 | Slide7.PNG (file) | 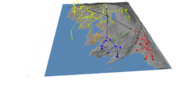 |
402 KB | 1 | |
| 09:57, 16 May 2017 | Slide6.PNG (file) | 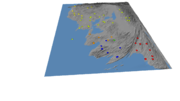 |
337 KB | 1 | |
| 09:56, 16 May 2017 | Slide5.PNG (file) | 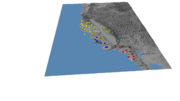 |
300 KB | 1 | |
| 09:56, 16 May 2017 | Slide3.PNG (file) | 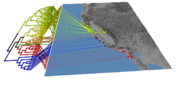 |
632 KB | 2 | |
| 09:53, 16 May 2017 | Slide4.PNG (file) |  |
101 KB | 1 | |
| 09:52, 16 May 2017 | Slide2.PNG (file) |  |
110 KB | 1 | |
| 09:52, 16 May 2017 | Slide1.PNG (file) |  |
95 KB | 1 | |
| 08:12, 16 May 2017 | Aneides.zip (file) | 4.34 MB | Archive containing the following files: - Cali.tif: the basemap - Aneides_locations_filtered.csv: the location file - Aneides_Filtered.tre: the mtDNA tree, with leaf labels corresponding to location IDs | 2 | |
| 20:56, 7 August 2014 | LachnoMovie x264.mp4 (file) | 6.05 MB | Flythrough of different microbial sampling locations, showing the relative abundance of the bacterial family Lachnospiraceae and different environmental types. | 1 | |
| 12:59, 7 August 2014 | EMP figs.png (file) | 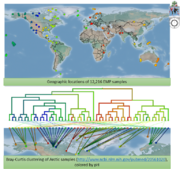 |
701 KB | Figures showing all samples available through the Earth Microbiome Project, and clustering of Arctic sites by pH (data from http://www.ncbi.nlm.nih.gov/pubmed/20561020) | 1 |
| 12:57, 7 August 2014 | NZ Pic3.png (file) |  |
262 KB | Phylogeny of New Zealand beetles, coloured by assigned clade. Data from Marske et al. (2009): http://www.ncbi.nlm.nih.gov/pubmed/19900173 | 1 |
| 12:56, 7 August 2014 | Sup05-2.png (file) |  |
336 KB | Clustering of microbial samples (Canberra distance) taken from different depths and locations along the Line-P transect. Data from Wright et al. (2012): http://www.ncbi.nlm.nih.gov/pubmed/22580367 | 1 |
| 12:55, 7 August 2014 | Sup05-1.png (file) |  |
661 KB | Taxonomic breakdown of samples by depth and Line-P transect location. Data from Wright et al. (2012): http://www.ncbi.nlm.nih.gov/pubmed/22580367 | 1 |
| 12:52, 7 August 2014 | MouseOrdination.png (file) | 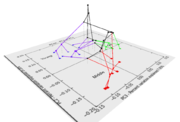 |
165 KB | Clustering of microbial samples from young, middle aged, and old mice, overlaid on an ordination plot. | 1 |
| 12:51, 7 August 2014 | HawaiiKatydids.png (file) | 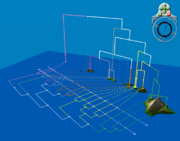 |
189 KB | Another view of Hawai'i katydid phylogeny. | 1 |
| 12:51, 7 August 2014 | Costello-body.png (file) | 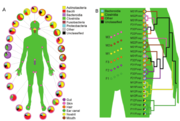 |
317 KB | Summary of taxonomic distributions of microbes at different body sites (A), and focused on the gut (B). Data from Costello et al. (2009): http://www.ncbi.nlm.nih.gov/pubmed/19892944 | 1 |
| 12:49, 7 August 2014 | Bio2.0.png (file) | 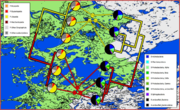 |
2.41 MB | Pilot samples from the Biomonitoring 2.0 project | 1 |
| 12:49, 7 August 2014 | AusOldWorld.png (file) | 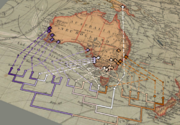 |
879 KB | Kangaroo apple phylogeny (Poczai et al., 2011: http://www.ncbi.nlm.nih.gov/pubmed/21258867) mapped onto old map of Australia | 1 |
| 07:43, 7 August 2014 | Hawaii.png (file) |  |
561 KB | Geophylogeny of Hawaii katydids | 1 |
| 07:09, 7 August 2014 | Cholera.png (file) | 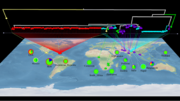 |
1.18 MB | GenGIS image of Vibrio cholerae dataset showing single-source introduction to Haiti. Data from Katz et al. (2013) http://www.ncbi.nlm.nih.gov/pubmed/23820394 Samples from Nepal are coded in cyan, samples from Haiti are in red. Pie charts show the dis... | 1 |
| 07:48, 8 August 2013 | GBIF x264.mp4 (file) | 60.03 MB | 1 | ||
| 06:50, 8 August 2013 | Basemap larger x264.mp4 (file) | 27.11 MB | 1 | ||
| 12:31, 6 August 2013 | EnvBarPlots.jpg (file) | 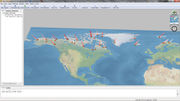 |
395 KB | 1 | |
| 12:29, 6 August 2013 | EnvDataPlugin.jpg (file) | 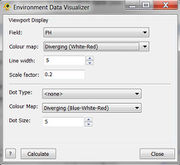 |
44 KB | 1 | |
| 18:28, 14 April 2013 | GOS4-PENnetwork.png (file) |  |
32 KB | CCA PEN | 1 |
| 18:27, 14 April 2013 | GOS3-CCA.png (file) | 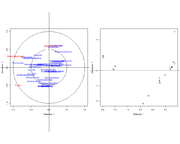 |
32 KB | CCA CCA | 1 |
| 18:27, 14 April 2013 | GOS2-GridSearch.png (file) | 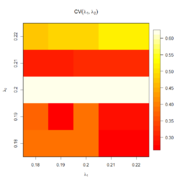 |
7 KB | CCA Grid Search | 1 |
| 18:26, 14 April 2013 | GOS1-MatCorr.png (file) |  |
763 KB | CCA Matrix Correlation | 1 |
| 13:29, 30 March 2012 | GenGIS GOS Map.zip (file) | 16.29 MB | tif map + world file for GOS data | 1 | |
| 06:23, 16 March 2012 | LR res.png (file) |  |
474 KB | Data values plotted on map. | 1 |
| 21:32, 4 June 2009 | H1N1 SwineFlu Trees.swf (file) | 43.38 MB | 2 | ||
| 21:25, 4 June 2009 | H1N1 SwineFlu Geophylogeny.swf (file) | 51.08 MB | Reverted to version as of 17:47, 4 June 2009 | 7 | |
| 10:15, 4 June 2009 | SouthPacificReduced.zip (file) | 62 KB | 1 | ||
| 10:15, 4 June 2009 | SouthPacific.zip (file) | 261 KB | 1 | ||
| 05:34, 16 May 2009 | WestAfrica.ascii (file) | 4.58 MB | 1 | ||
| 10:21, 14 May 2009 | Apr27-XPress.swf (file) | 5.02 MB | 1 | ||
| 11:38, 13 May 2009 | H1N1-May3-NA-cluster-CHC.png (file) |  |
76 KB | 1 | |
| 11:28, 13 May 2009 | H1N1-Apr26-HA-cluster-USA.png (file) |  |
151 KB | 1 | |
| 11:28, 13 May 2009 | H1N1-Apr26-HA-cluster-ESP.png (file) | 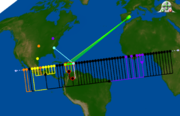 |
184 KB | 1 | |
| 11:14, 13 May 2009 | H1N1-Apr26-HA-clusters.png (file) |  |
237 KB | 1 | |
| 10:52, 13 May 2009 | H1N1-Apr15-HA-tree-HA297.png (file) |  |
198 KB | 1 | |
| 10:44, 13 May 2009 | H1N1-Apr1-15-HA-tree.png (file) |  |
230 KB | 1 | |
| 10:41, 13 May 2009 | H1N1-May4-10-cases.png (file) |  |
126 KB | 1 | |
| 10:38, 13 May 2009 | H1N1-Apr27-May3-cases.png (file) |  |
126 KB | 1 | |
| 09:18, 13 May 2009 | H1N1-Apr16-26-cases.png (file) |  |
157 KB | 1 | |
| 09:15, 13 May 2009 | H1N1-Apr1-15-cases.png (file) |  |
169 KB | 1 | |
| 09:08, 13 May 2009 | H1N1-March30-cases.png (file) |  |
233 KB | 1 |