File list
From Bioinformatics Software
Jump to navigationJump to searchThis special page shows all uploaded files.
| Date | Name | Thumbnail | Size | User | Description | Versions |
|---|---|---|---|---|---|---|
| 23:54, 23 June 2008 | RobRSSfeeds.xml.gz (file) | 945 bytes | Beiko | 1 | ||
| 17:47, 10 May 2011 | CreateProfileDlg.zip (file) | 2 KB | Dparks | 4 | ||
| 17:48, 10 May 2011 | CreateProfileDlg patch.zip (file) | 2 KB | Dparks | 1 | ||
| 22:59, 4 August 2014 | CheckHierarchy.zip (file) | 2 KB | Dparks | 1 | ||
| 00:17, 24 June 2008 | ESconfig.tar.gz (file) | 3 KB | Beiko | 1 | ||
| 16:24, 1 May 2015 | Guppy primers.txt (file) | 5 KB | Beiko | 1 | ||
| 04:30, 18 November 2009 | StampIcon.png (file) |  |
7 KB | Dparks | Program icon by Caihua (http://commons.wikimedia.org/wiki/File:Fairytale_colors.png) | 1 |
| 21:40, 10 April 2012 | README NetworkDiversity.txt (file) | 8 KB | Dparks | 1 | ||
| 13:06, 9 July 2012 | 244 taxa chosen.txt (file) | 8 KB | Whidden | 1 | ||
| 04:11, 3 June 2013 | README EBD.txt (file) | 9 KB | Dparks | 7 | ||
| 14:14, 6 December 2011 | README.txt (file) | 11 KB | Dparks | Reverted to version as of 14:56, 3 November 2011 | 5 | |
| 05:23, 22 November 2009 | IronMineSequenceHistogram.png (file) |  |
13 KB | Dparks | Sequence histogram for a pair of iron mine metagenomes (data described in Edwards et al., 2006). | 1 |
| 18:10, 18 December 2012 | SPANNER.tar.gz (file) | 13 KB | Mporter | v1.0.0; initial release | 1 | |
| 20:44, 26 July 2013 | README RSPR.txt (file) | 14 KB | Cwhidden | 3 | ||
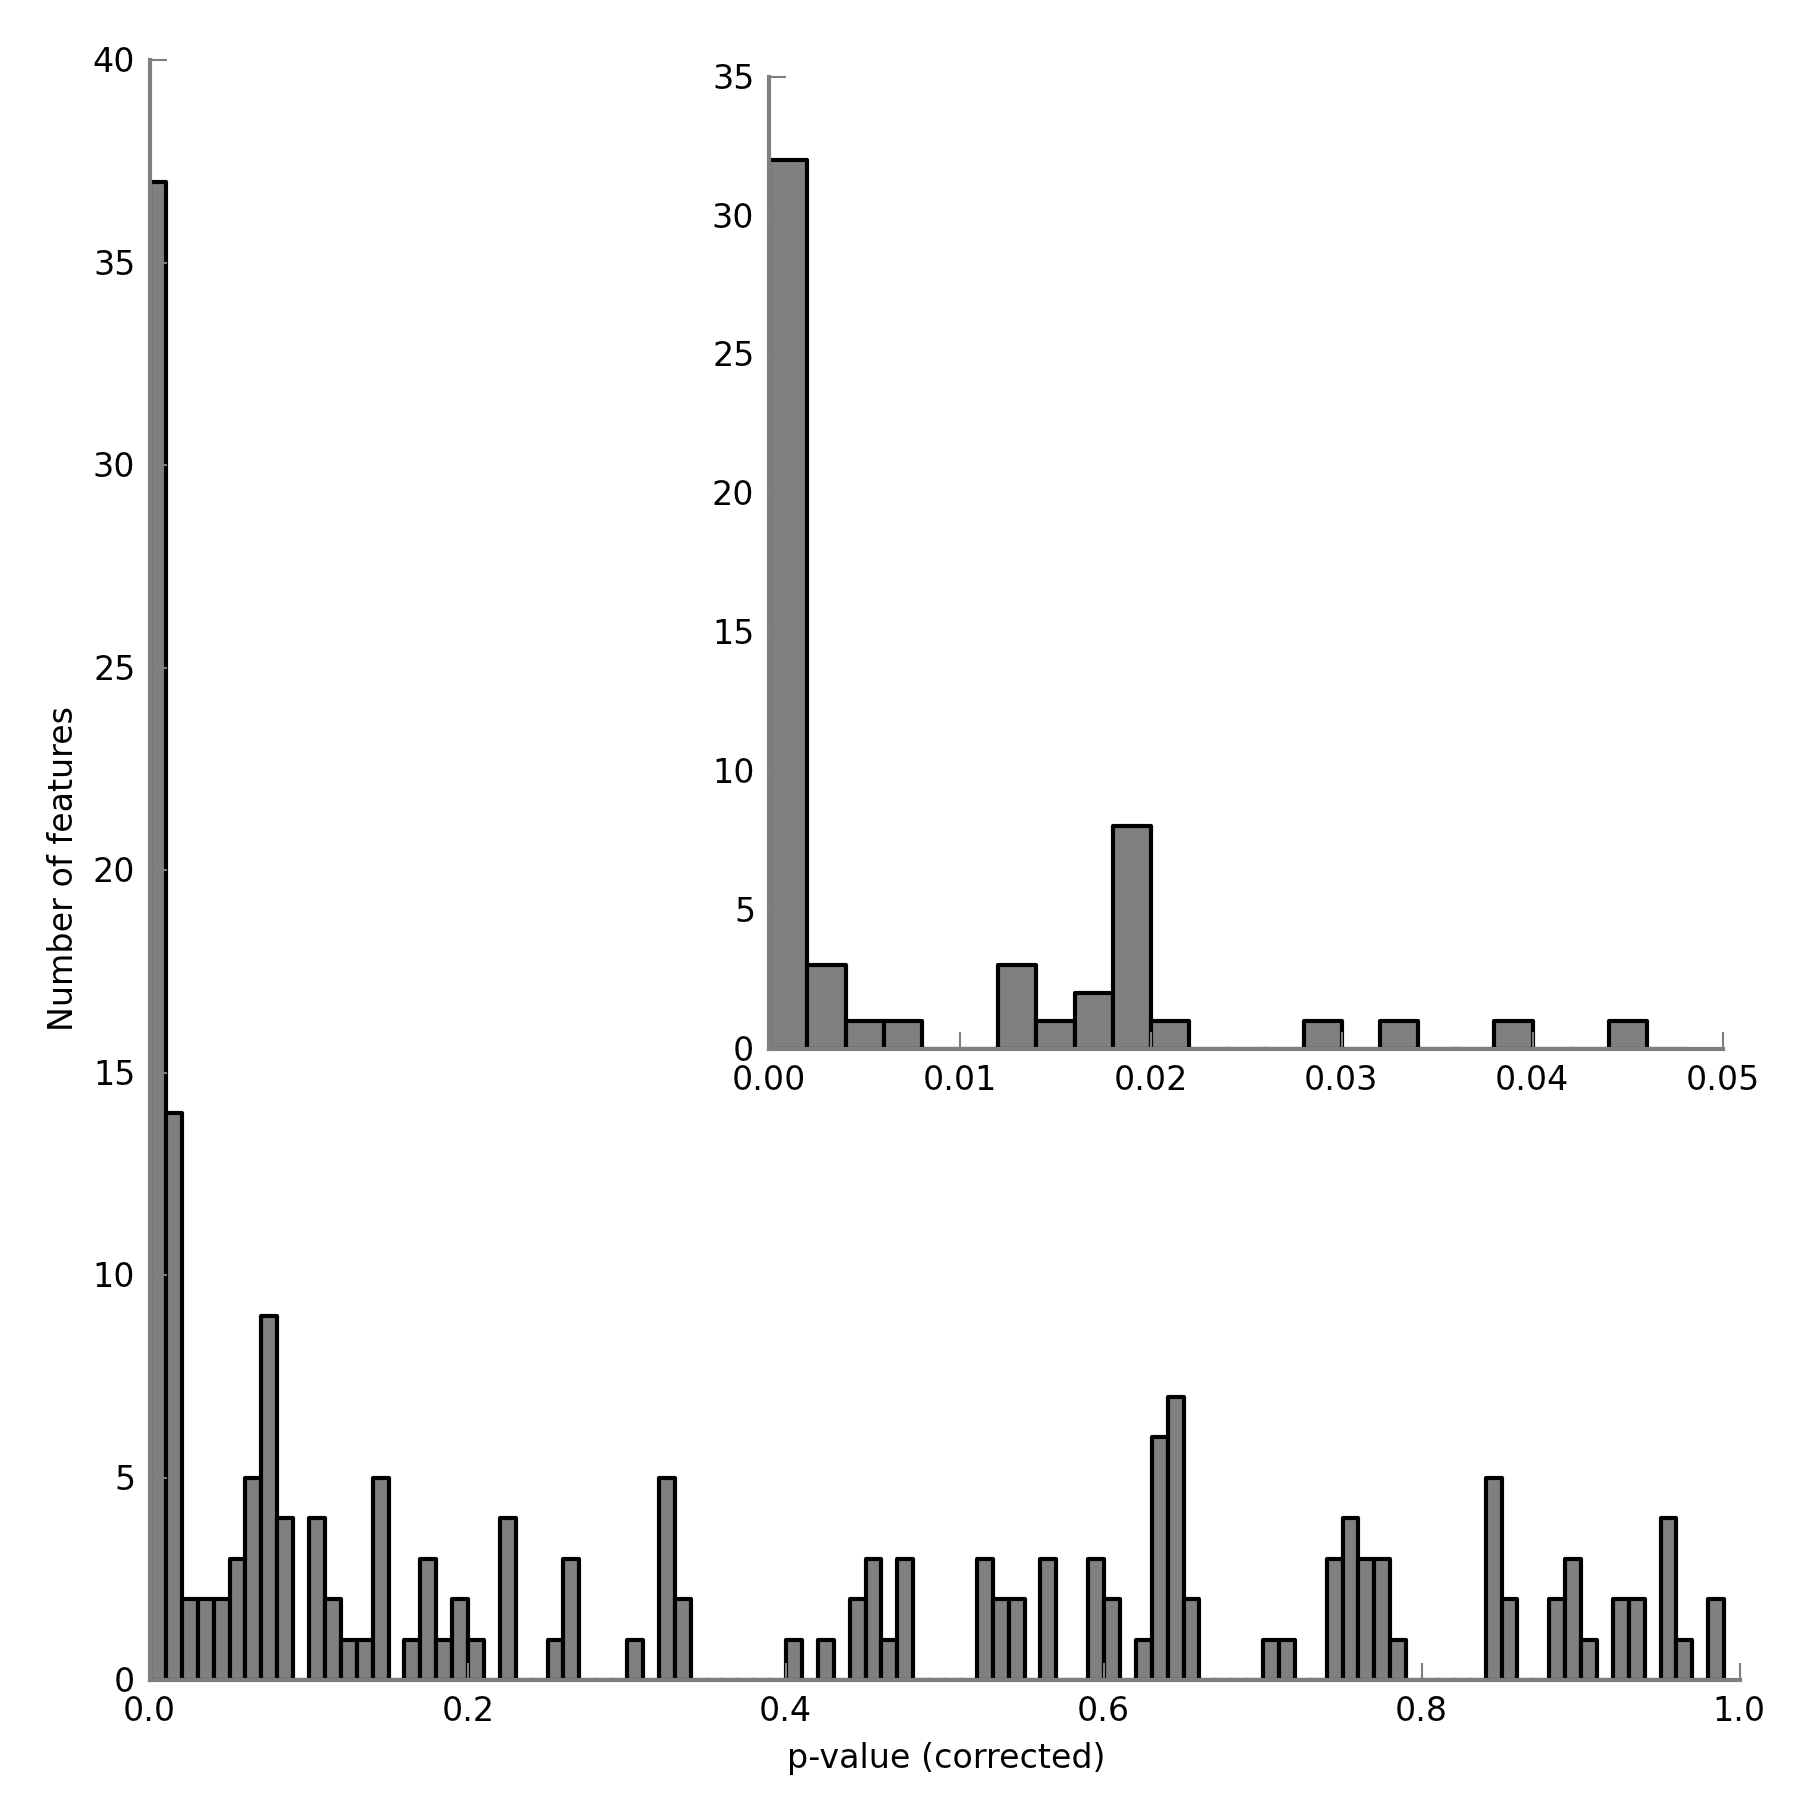
| 05:52, 22 November 2009 | IronMine pValueHistogram.png (file) |  |
15 KB | Dparks | p-value histogram for a pair of iron mine metagenomes (data described in Edwards et al., 2006). | 1 |
| 17:32, 26 April 2013 | README SPR Supertrees.txt (file) | 16 KB | Cwhidden | 11 | ||
| 13:06, 9 July 2012 | 244 taxa supertree.newick (file) | 17 KB | Whidden | 1 | ||
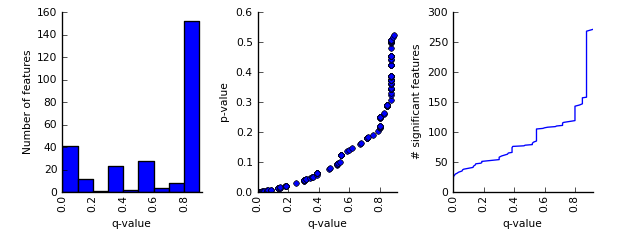
| 05:36, 22 November 2009 | MultipleComparisonPlots StoreyFDR.png (file) |  |
20 KB | Dparks | Multiple comparison plots for analyzing the effects of Storey's false discovery rate method (see Leek and Storey, 2008). | 1 |
| 17:22, 6 March 2012 | RITA v1 0 1.zip (file) | 25 KB | Dparks | 1 | ||
| 21:47, 12 July 2011 | RITA v1 0 0.zip (file) | 26 KB | Norman | 1 | ||
| 17:01, 19 March 2010 | Rspr 1 00 source.zip (file) | 29 KB | Cwhidden | rSPR software version 1.00 | 1 | |
| 17:25, 23 March 2010 | Rspr 1 01 source.zip (file) | 35 KB | Cwhidden | 2 | ||
| 16:34, 1 May 2015 | MEGASAT Example.fastq (file) | 36 KB | Beiko | 1 | ||
| 02:07, 8 December 2009 | MartinEBPR A phosphatis.spf (file) | 41 KB | Dparks | SEED functional profile for Candidatus Accumulibacter phosphatis (data originally described in Martín et al., 2006) . | 1 | |
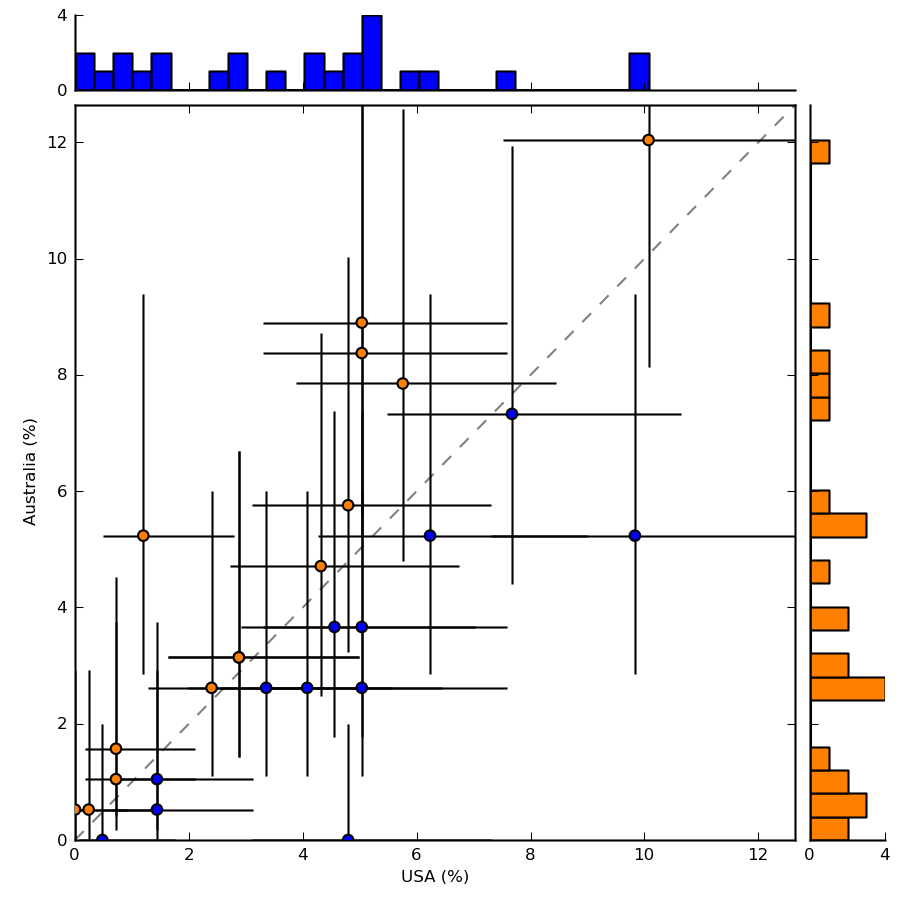
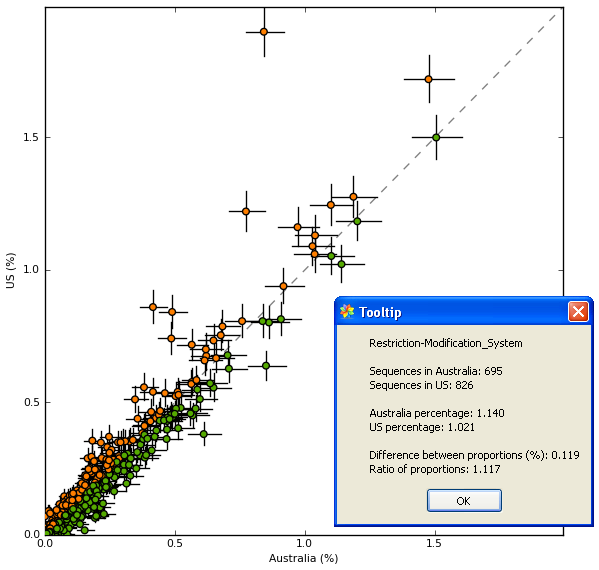
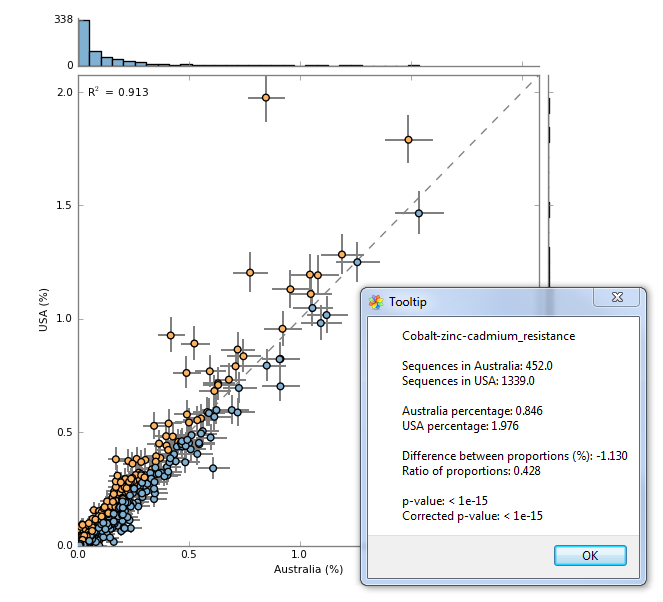
| 15:26, 17 July 2010 | EBPR Aphosphatis ScatterplotHistogram.png (file) |  |
43 KB | Dparks | Scatterplot with histograms showing the functional profile of A.phosphatis sequences from EBPR communities in the USA and Australia. | 1 |
| 02:09, 8 December 2009 | MouseTurnbaughMG-RAST Functional.spf (file) | 44 KB | Dparks | SEED taxonomic profile for an obese and lean mouse microbiome (data originally described in Turnbaugh et al., 2006) . | 1 | |
| 16:27, 29 November 2009 | EBPR ScatterPlot.png (file) |  |
46 KB | Dparks | SEED subsystem scatter plot for a pair of enhanced biological phosphorus removal (EBPR) sludge metagenomes (data from Martín et al., 2006]). | 2 |
| 00:15, 24 June 2008 | BeikoCharleboisDoolittleFig3.pdf (file) | 48 KB | Beiko | 1 | ||
| 00:17, 24 June 2008 | NBLASTP.tar.gz (file) | 48 KB | Beiko | 1 | ||
| 12:59, 6 June 2008 | Test.pdf (file) | 49 KB | Christian | Solutions to Chapter 2 (exercises) | 1 | |
| 06:14, 22 November 2009 | MouseTurnbaugh.spf (file) | 53 KB | Dparks | Functional profile for an obese and lean mouse microbiome (data originally described in Turnbaugh et al., 2006). | 1 | |
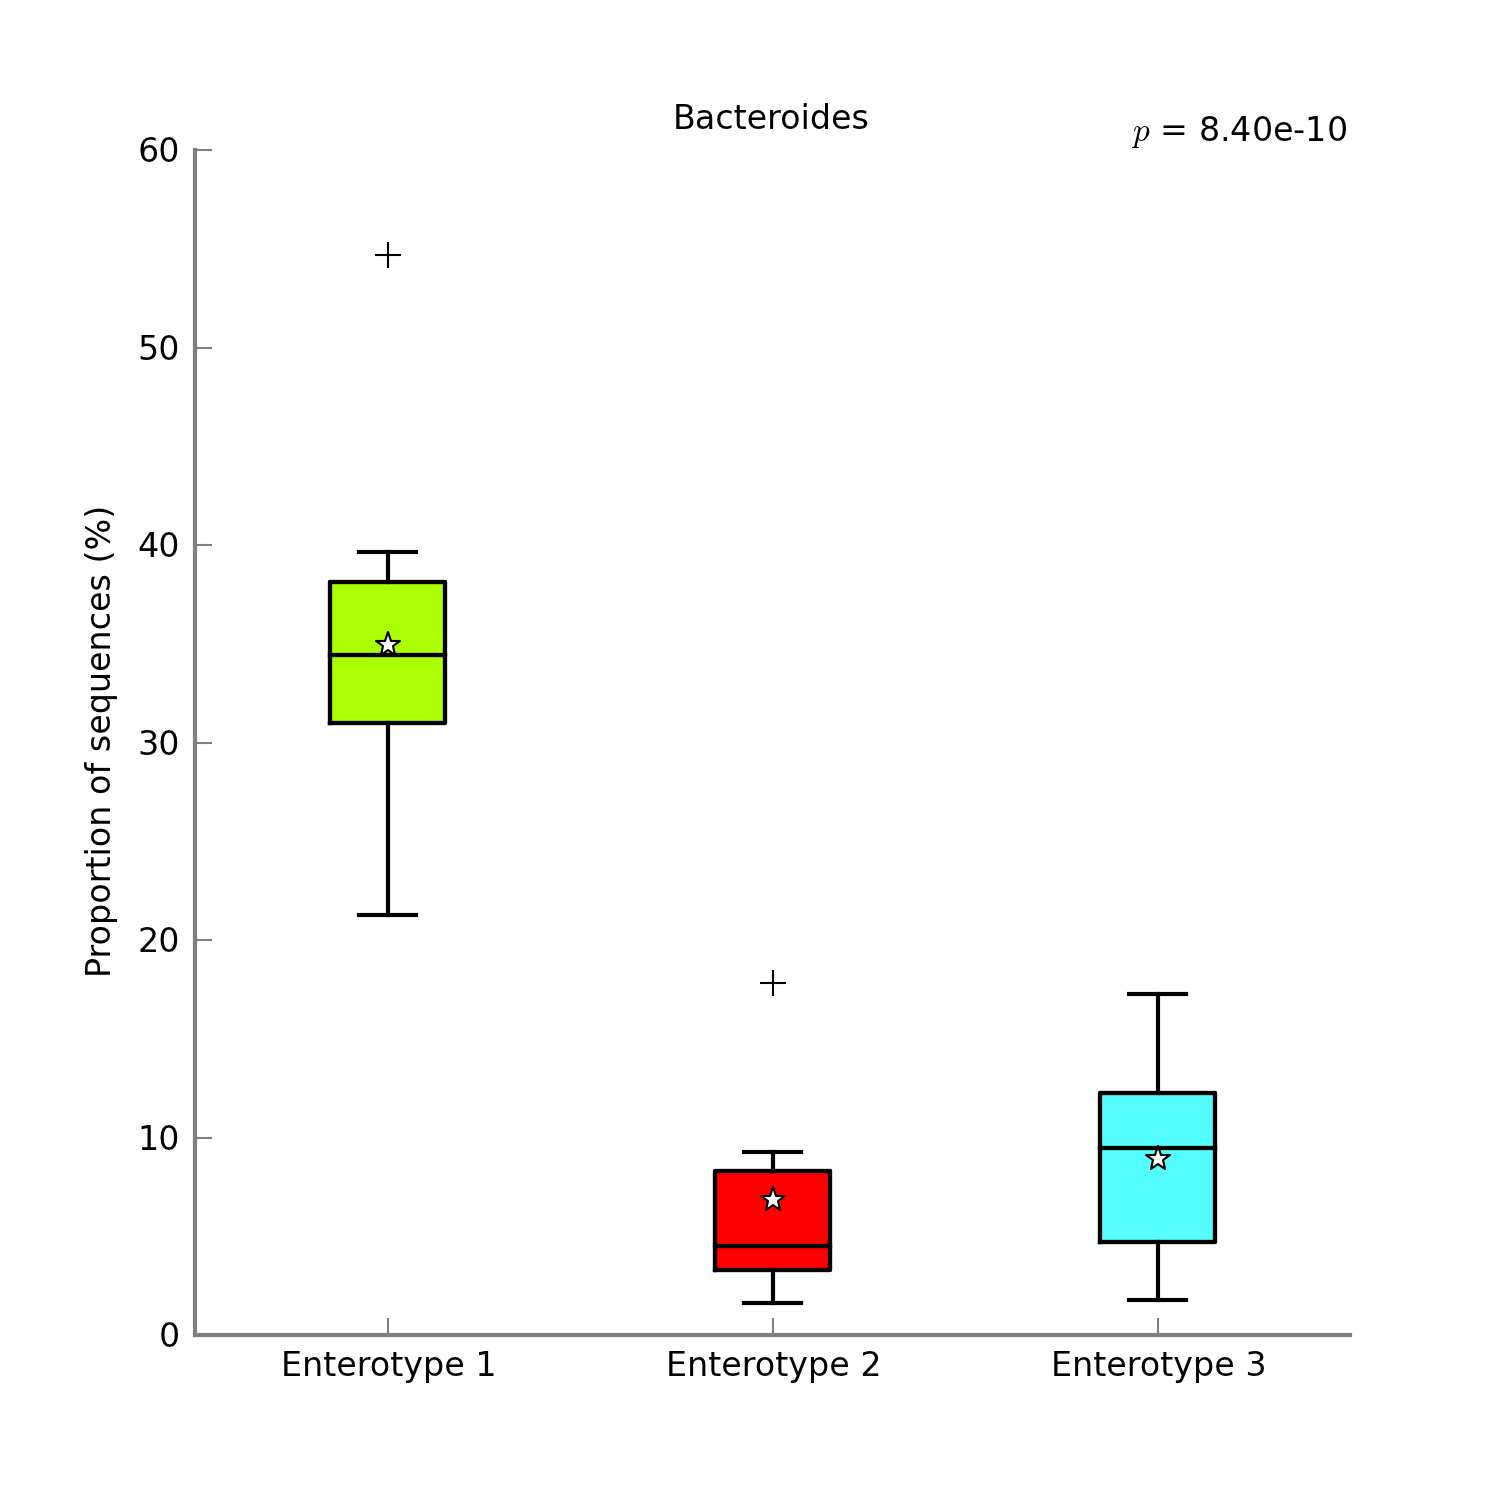
| 12:33, 11 August 2011 | ArumugamBoxPlot.png (file) |  |
55 KB | Dparks | Box plot of Arumugam et al. enterotype data. | 1 |
| 00:12, 24 June 2008 | HGTchapter-Figure2.pdf (file) | 56 KB | Beiko | 1 | ||
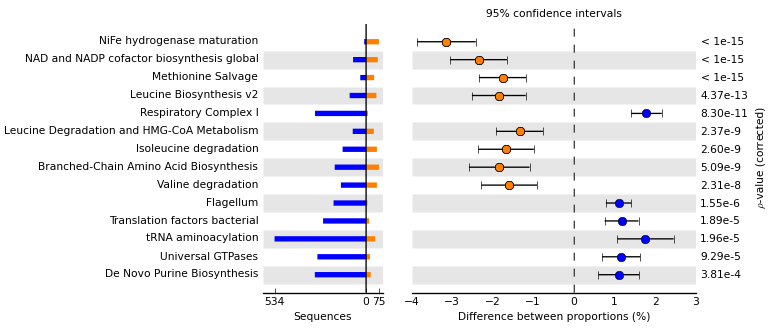
| 03:41, 18 November 2009 | RedBlackErrorBar.png (file) |  |
56 KB | Dparks | Using STAMP to identify SEED subsystems which are differentially abundant in a pair of iron mine metagenomes (data original described in Edwards et al., 2006). | 2 |
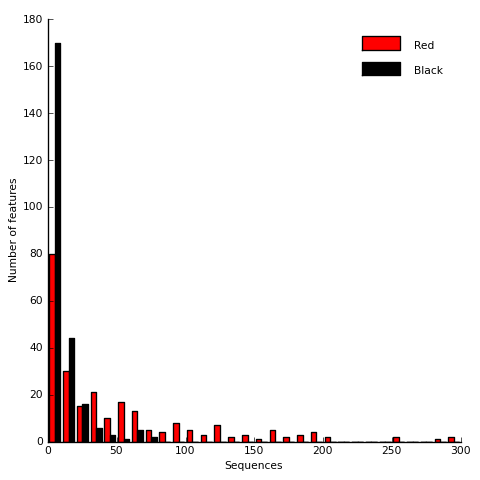
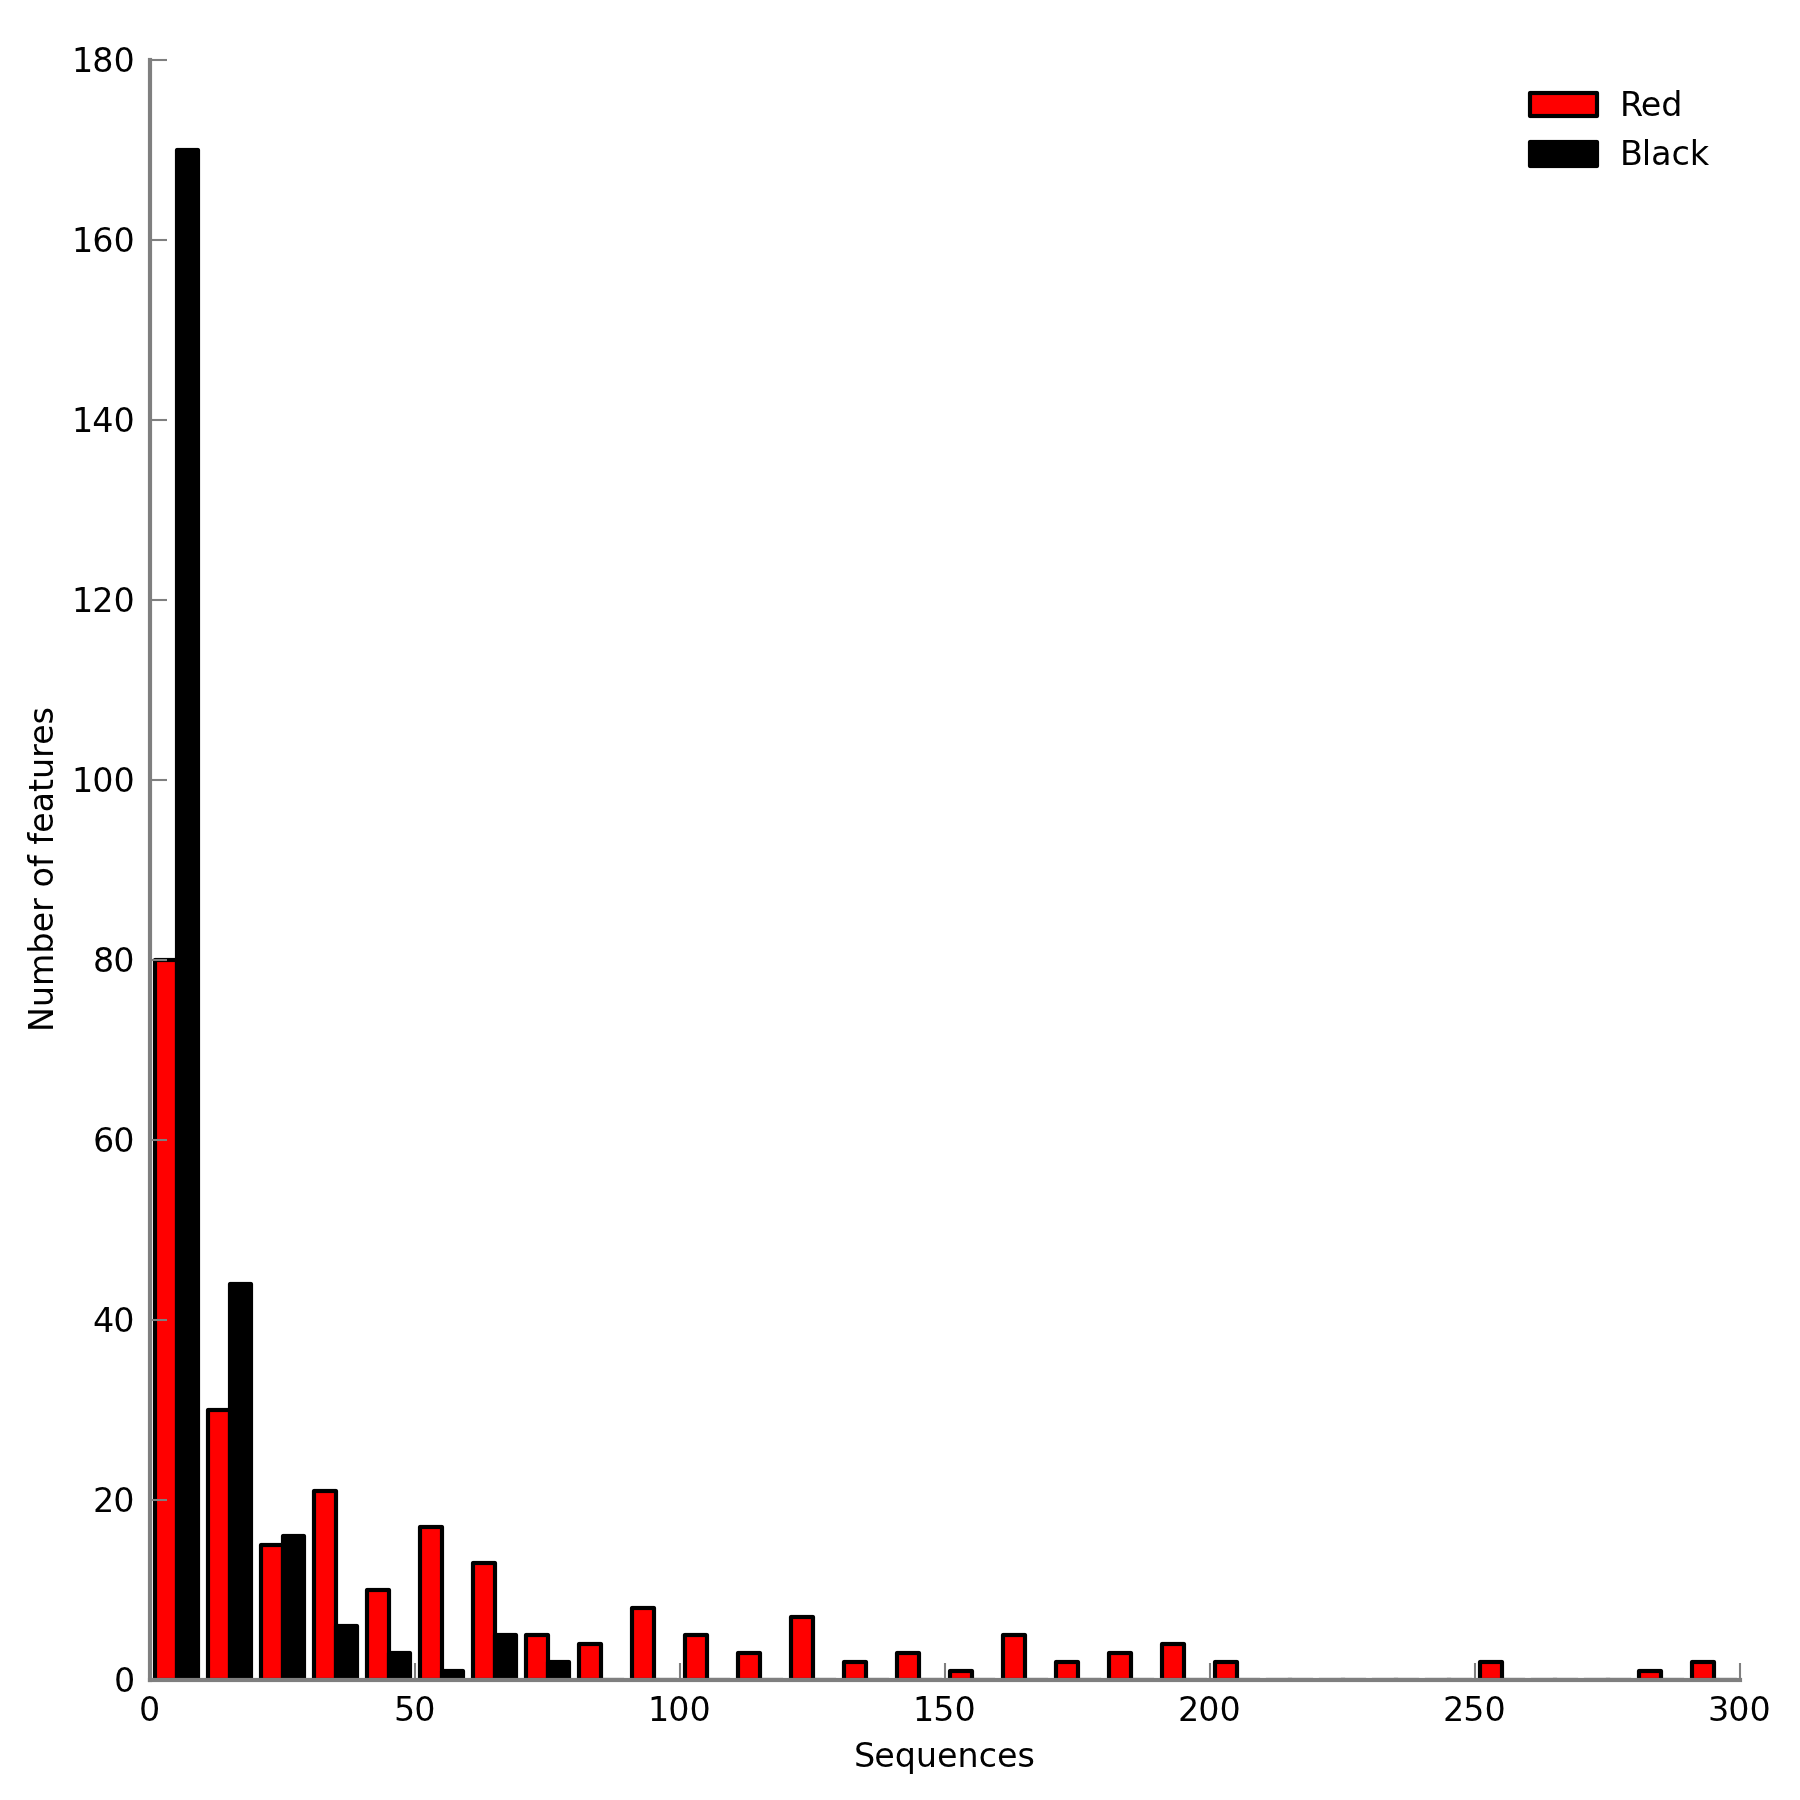
| 14:06, 11 August 2011 | STAMP2 IronMinSequenceHistogram.png (file) |  |
59 KB | Dparks | Sequence histogram for a pair of iron mine metagenomes. | 1 |
| 15:28, 3 November 2011 | Rspr 1 02 source.zip (file) | 63 KB | Cwhidden | 2 | ||
| 14:36, 3 May 2012 | Rspr 1 03 source.zip (file) | 64 KB | Cwhidden | 3 | ||
| 18:38, 2 November 2011 | Spr supertrees 1 0 0.zip (file) | 64 KB | Cwhidden | 2 | ||
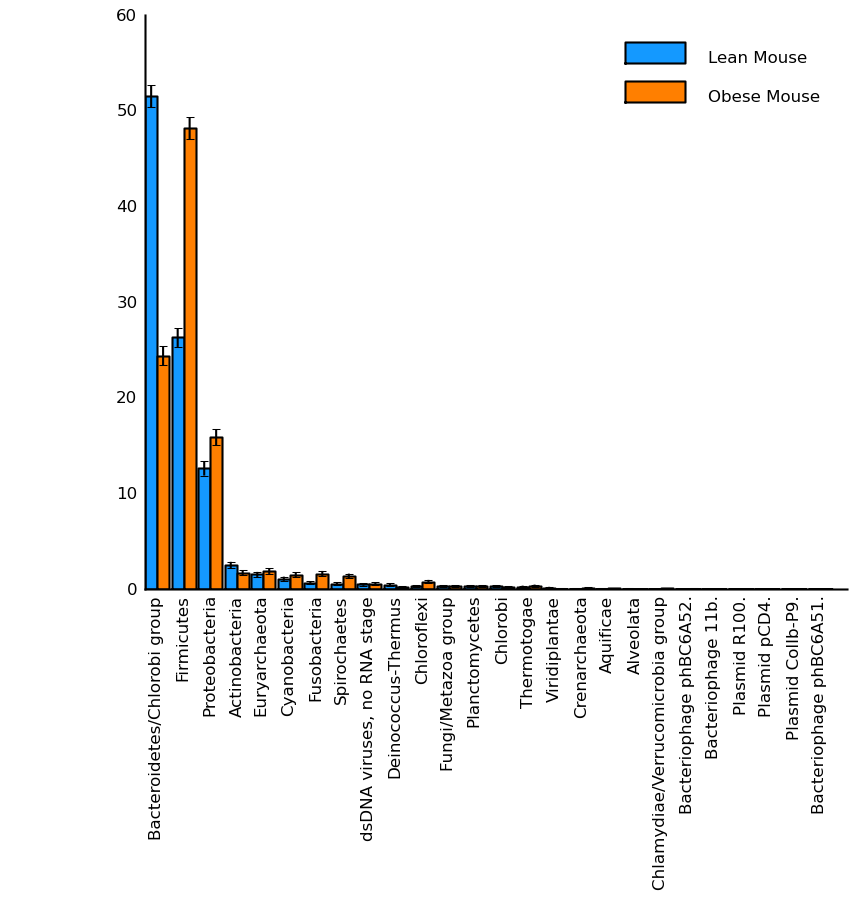
| 16:24, 29 November 2009 | TurnbaughMouseProfilePlot.png (file) |  |
64 KB | Dparks | Taxonomy profile plot for an obese and lean mouse microbiome(data from described in Turnbaugh et al., 2006). | 3 |
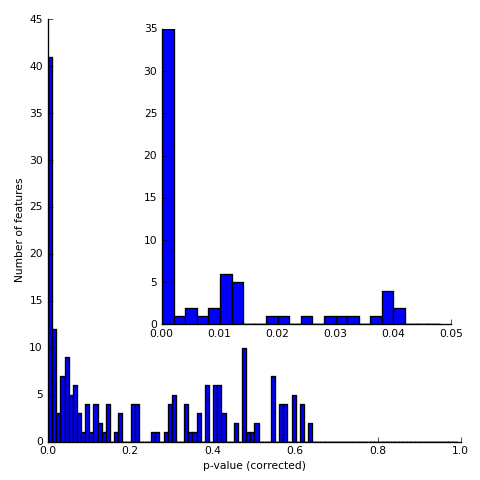
| 14:11, 11 August 2011 | STAMP2 IronMine pValueHistogram.png (file) |  |
66 KB | Dparks | p-value histogram for two iron mine metagenomes | 1 |
| 12:33, 11 August 2011 | ArumugamPostHocPlot.png (file) | 67 KB | Dparks | Post-hoc plot of Arumugam et al. enterotype data. | 1 | |
| 14:02, 11 August 2011 | STAMP2 EBPR ScatterPlot.png (file) |  |
69 KB | Dparks | SEED subsystem scatter plot for a pair of enhanced biological phosphorus removal (EBPR) sludge metagenomes. | 1 |
| 00:12, 24 June 2008 | HGTchapter-Figure1.pdf (file) | 74 KB | Beiko | 1 | ||
| 13:22, 11 July 2012 | Rspr 1 1 0 source.zip (file) | 78 KB | Whidden | 2 | ||
| 18:06, 21 January 2013 | Rspr 1 1 1 source.zip (file) | 78 KB | Cwhidden | 1 | ||
| 18:24, 9 February 2011 | FCP 1 0 0.tar.gz (file) | 81 KB | Dparks | FCP v1.0.0 | 9 | |
| 14:18, 28 April 2011 | FCP 1 0 1.tar.gz (file) | 82 KB | Dparks | FCP v1.0.1 | 1 | |
| 20:34, 3 June 2011 | FCP 1 0 2.tar.gz (file) | 82 KB | Dparks | FCP v1.0.2 | 7 | |
| 13:36, 13 July 2011 | FCP 1 0 3.tar.gz (file) | 82 KB | Dparks | FCP v1.0.3 | 1 | |
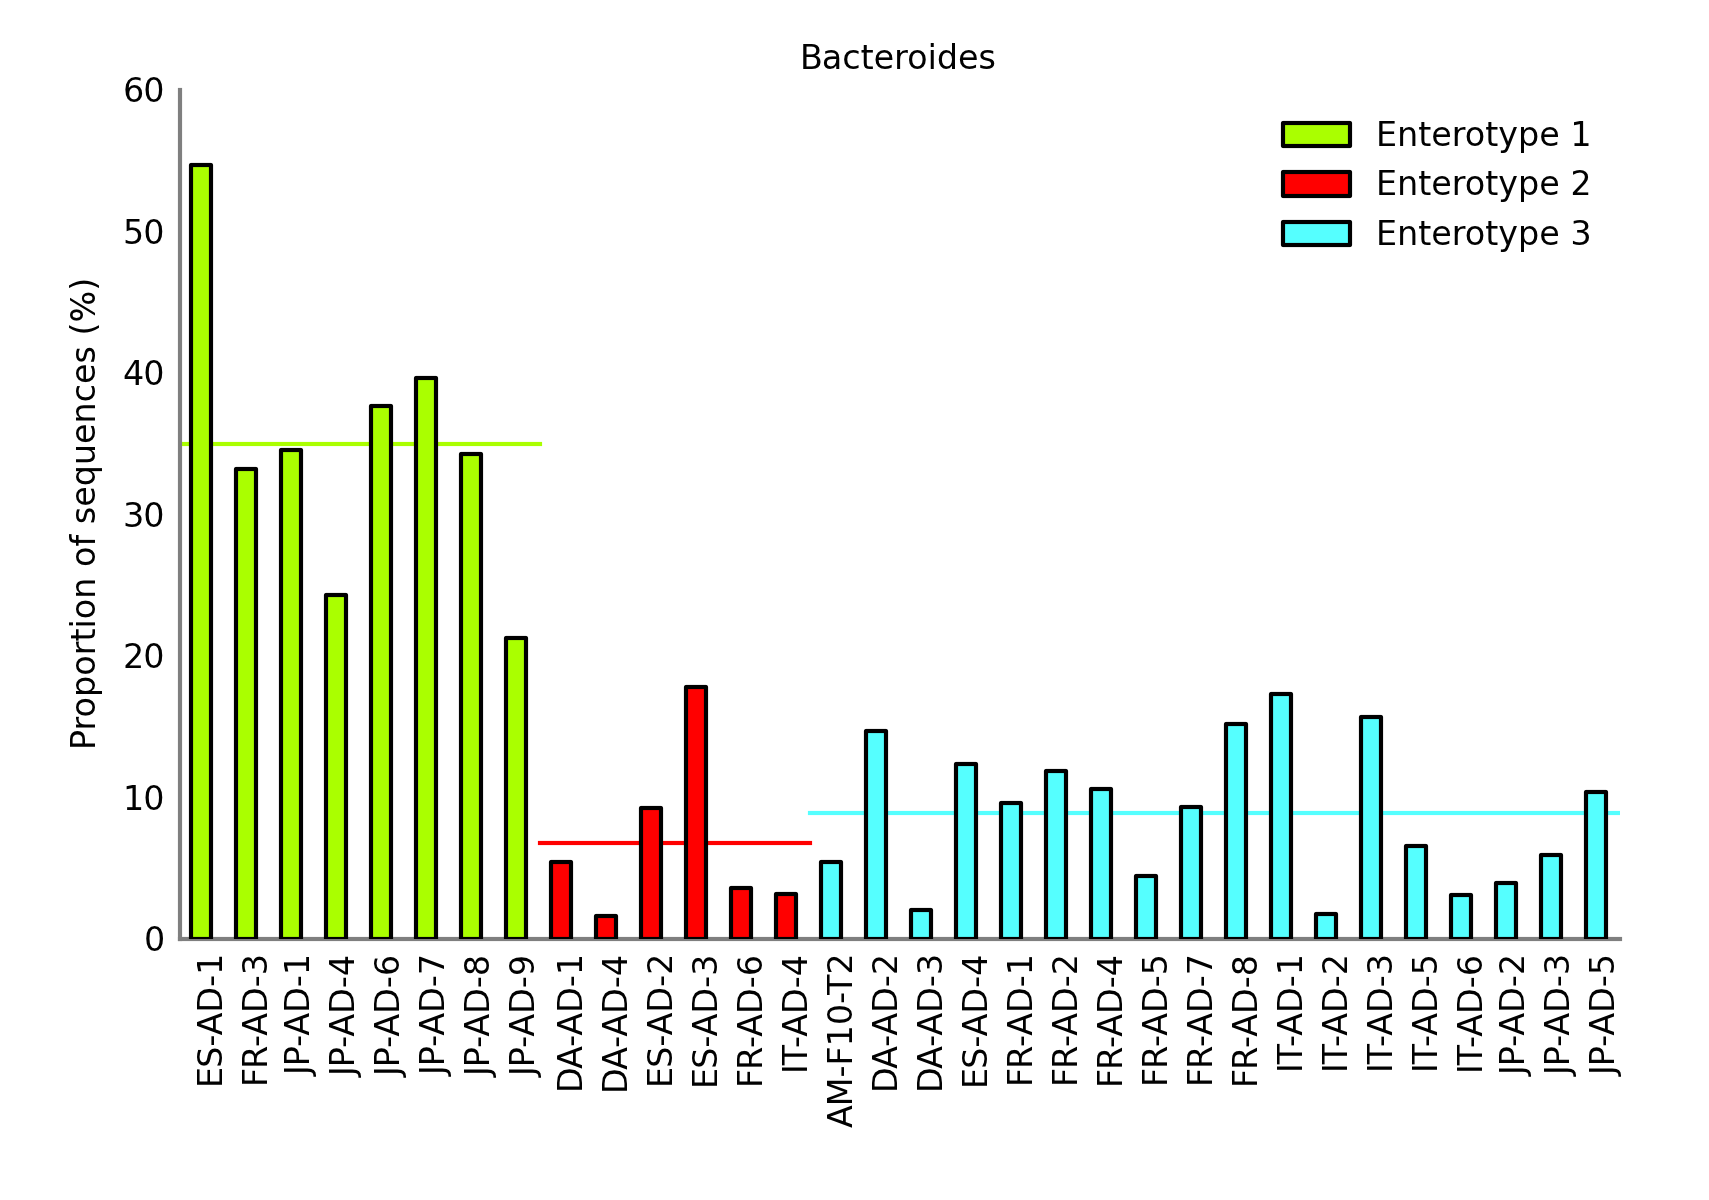
| 12:32, 11 August 2011 | ArumugamBarPlot.png (file) |  |
84 KB | Dparks | Bar plot of Arumugam et al. enterotype data. | 1 |