Difference between revisions of "GenGIS Tutorials"
| Line 38: | Line 38: | ||
=== References === | === References === | ||
| − | + | Shapiro LH, Strazanac JS, and Roderick GK. 2006 Molecular phylogeny of Banza (Orthoptera: Tettigoniidae), the endemic katydids of the Hawaiian Archipelago. ''Mol. Phylogenet. Evol.'' '''41''':53-63. [http://www.ncbi.nlm.nih.gov/pubmed/16781170 Pubmed] | |
| − | + | Rusch DB, Halpern AL, Sutton G, ''et al.'' .2007. The Sorcerer II Global Ocean Sampling Expedition: Northwest Atlantic through Eastern Tropical Pacific. ''PLoS Biol.'' '''5''':e77. [http://www.ncbi.nlm.nih.gov/pubmed/17355176 PubMed] | |
| + | |||
| + | Parks DH and Beiko RG. 2009. Quantitative visualizations of hierarchically organized data in a geographic context. ''Geoinformatics 2009'', Fairfax, VA. | ||
Revision as of 12:48, 2 March 2012
We have put together a few tutorials to get you quickly started with GenGIS.
Contents
Tutorial 0: Obtaining Custom Digital Elevation Maps (DEM)
The simple way to obtain DEMs suitable for use in GenGIS is described here. An older set of instructions on how to manually contruct a custom DEM is available here. You can also obtain 2D maps compatible with GenGIS using MapMaker.
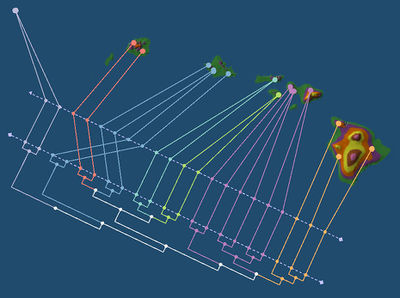
Tutorial 1: Banza Katydids of the Hawaiian Islands
In this tutorial, we consider the phylogenetic tree of Banza katydids (acoustic insects) from the Hawaiian Islands recently recovered by Shapiro et al., 2006. This tutorial gives an overview of the GenGIS interface, demonstrates how to load data, and illustrates how to change the visual properties of a map, location markers, and trees. The tutorial concludes with an analysis which suggests geography has had a substantial influence on the evolution of Banza katydids.
Tutorial 2: Marine Microbial Communities from the Atlantic Seaboard
In this tutorial, we examine samples collected as part of the Global Ocean Sampling expedition (Rusch et al., 2007) in order to investigate the influence of environmental factors on the composition of microbial communities from marine ecosystems. This tutorial demonstrates how to load data, illustrates how to change visual properties, presents a detail analysis of the geographic structure of these microbial communities, and examines the distribution of taxa within these samples.
Tutorial 3: Custom Data Visualizations and Movies
We have put together a number of examples illustrating how custom data visualizations and movies can be created using the API exposed to the Python console:
- Short examples of using the API are available in the GenGIS manual.
- An example showing how GenGIS can be used to visualize the mobility rates of HIV-1 subtype B in Europe as proposed by Paraskevis et al. (2009) has been posted here. This example includes a Python class demonstrating how a custom visualization can be made.
References
Shapiro LH, Strazanac JS, and Roderick GK. 2006 Molecular phylogeny of Banza (Orthoptera: Tettigoniidae), the endemic katydids of the Hawaiian Archipelago. Mol. Phylogenet. Evol. 41:53-63. Pubmed
Rusch DB, Halpern AL, Sutton G, et al. .2007. The Sorcerer II Global Ocean Sampling Expedition: Northwest Atlantic through Eastern Tropical Pacific. PLoS Biol. 5:e77. PubMed
Parks DH and Beiko RG. 2009. Quantitative visualizations of hierarchically organized data in a geographic context. Geoinformatics 2009, Fairfax, VA.
