West Coast Salamander Tutorial
Contents
Introduction
GenGIS is a free and open-source bioinformatics application that allows geographic data to be merged with information about biological sequences collected from the environment. It consists of a 3D graphical user interface in which the user can navigate and explore the data, as well as a Python interface that allows easy scripting of statistical analyses using the Rpy libraries.
The Ensatina eschscholtzii salamander from the western United States is a classic example of allopatric speciation. In this tutorial, we demonstrate how GenGIS can be used to analyze non-linear geographic gradients (Parks and Beiko, 2009). To follow along with this tutorial download the data:
This tutorial assumes you have already worked through the Banza Katydid and GOS tutorials. In particular, it assumes you are familiar with how geophylogenies are analyzed within GenGIS (Parks and Beiko, 2009; Parks et al., 2009).
Loading Data
The Salamander data consists of a 2D map (WestCoast.tif), projection information for the map (WestCoast.tfw), location data (salamander.csv), and a geophylogeny (salamander.tre). Load this data into GenGIS. For basic information on using the GenGIS interface and loading data please see the Banza Katydid Tutorial.
Changing Visual Properties
The location set properties were so the colour of a location reflects the Subspecies sampled at that location. The properties of the geophylogeny were set so location colours are discretely propagated through the tree. Other tree properties such as the height of the tree and the size of internal nodes were also set to improve visual clarity. For further details on setting visual properties see the Banza Katydid or GOS tutorials.
Quantitative Analysis of Non-linear Gradients
Non-linear geographic gradients can be evaluated in GenGIS using the Geographic Axis toolbar button. This allows a polyline to be drawn which represents the non-linear gradient to be evaluated. The polyline is drawn by sequentially clicking on the map to place control points representing the end of each line segment. A polyline can be finalized by hitting the Enter key. If desired, additional line segments extending from an existing control point can be added by right-clicking on the control point and selecting Extend geographic axis from the pop-up menu. To assign a non-linear geographic axis to a tree, right-click the tree in the Layer Tree and select Assign geographic axes to tree from the pop-up menu. The video tutorial demonstrates the construction of a multi-segment polyline.
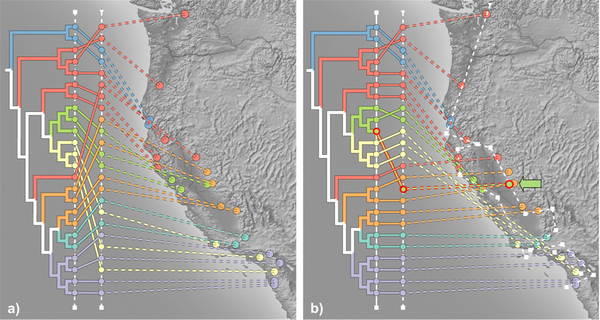
Here a non-linear geographic gradient is contrasts with a strictly linear gradient in order to evaluate two alternative hypotheses concerning the biogeographic history of the Ensatina eschscholtzii salamanders. First the hypothesis that these salamanders originated in the redwood forests of southern Oregon and migrated down the western United States during periods of greater humidity is considered. This hypothesis is illustrated in Figure 1a and results in 37 crossings occur between the correlation lines. This is significantly non-random at P ≤ 0.0004, which provides support for this hypothesis. However, by assigning unique colours to each sub-species a heterogeneous distribution of colours along the linear gradient is observed which indicates that sub-species are highly intermixed along this geographic axis. Alternatively, while moving down the western United States the salamanders may have dispersed down separate coastal and inland ranges (Stebbins, 1949). This hypothesis is shown in Figure 1b and results in only 11 crossings (P ≤ 0.0001). Crossings that occur with this geographic axis have important biological and geographic significance. For example, the highlighted geographic point is the cause of several crossings. This point is from the Sierran population of the xanthoptica sub-species which is found primarily along the coast. It is hypothesized that the Sierran population evolved from the coastal population during a mesic (moderately moist) period of the Pleistocene epoch (Mortiz et al., 1992).

Contact Information
We encourage you to send us suggestions for new features. GenGIS is in active development and we are interested in discussing all potential applications of this software. Suggestions, comments, and bug reports can be sent to Rob Beiko (beiko@cs.dal.ca). If reporting a bug, please provide as much information as possible and, if possible, a simplified version of the data set which causes the bug. This will allow us to quickly resolve the issue.
References
Moritz C, Schneider CJ, Wake DB. 1992. Evolutionary relationships within the Ensatina eschscholtzii complex confirm the ring species interpretation. Syst Biol, 41: 273-291.
Parks DH and Beiko RG. 2009. Quantitative visualizations of hierarchically organized data in a geographic context. Geoinformatics 2009, Fairfax, VA. IEEE Xplore
Parks DH, Porter M, Churcher S, Wang S, Blouin C, Whalley J, Brooks S and Beiko RG. 2009. GenGIS: A geospatial information system for genomic data. Genome Research, 19: 1896-1904. (Abstract)
Stebbins RC. 1949. Speciation in salamanders of the Plethodontid genus Ensatina. Univ Calif Publ Zool, 48: 377-526.